Michaela Herout — Year 2, Life Science
Abstract
Electrical oscillations are found within bacteria species and offer a non-invasive method for monitoring bacterial activity that is more reliable than visual identification. This study researched whether voltage, current, and resistance across Escherichia coli (E. coli), Pseudomonas putida (P. putida), and Bacillus cereus (B. cereus), exhibit distinct electrical patterns using aluminum electrodes and a digital multimeter. The findings demonstrated that E. coli produced the highest and most consistent electrical oscillations; P. putida displayed the most variability in results, and B. cereus had a consistent increase in resistance. These results indicate that electrical properties change between different bacterial species and can potentially reflect biological activities such as biofilm formation and ion exchange.
Introduction
Electrical oscillations are found within bacterial biofilms and are created through metabolism, ion movement, and redox reactions. Bacteria exchange ions with their environment for their metabolic processes. This exchange alters the electrical oscillations in the cells. Research has shown that bacterial communities display electrical oscillations collectively, rather than individually, as isolated cells (Guliy et al. 2022). These oscillations are often used as detectors of biological activity such as metabolism and biofilm development, providing a minimally invasive indicator of those reactions. Electrical measurements allow for monitoring without dependency on visual cues solely. Shifts in these voltages can reflect changes in population density and metabolic activity. Bacteria vary in electrical activity, due to different metabolisms, cell wall structures, and growth patterns. Comparing a multitude of bacteria’s electrical oscillations can aid in the understanding of whether electrical measurements are universal or dependent on each species (Guliy et al. 2022).
Biosensors are analytical devices that can convert biological activity into electrical signals (Mehrotra, 2016). They are used in many fields, including the food industry for quality control and to determine natural and artificial products, the fermentation industry to detect glucose concentrations, in biomedical engineering for vivo monitoring of cellular metabolism, and in the medical industry (Mehrotra, 2016). There are many types of biosensors which are used in different settings. If the proposed study proves successful, it may provide another detection signal, electrical patterns, for biosensors in addition to light, heat, and antibody binding, which are currently used by scientists.
According to Guliy et al. (2022), bacteria contain many unique properties that can be measured electrically to differentiate between the state of growth for microorganisms. A research experiment was conducted to prove that within the bacteria strain Pseudomonas putida (P. putida) it can produce vastly different electrical oscillations, depending on what stage it is within in its biofilm growth. The article explains how electrical signaling is impacted by lipopolysaccharides as well as proteins that are found on the surface of bacterial cells. These create an allocation of charges and ions which can be detected through sensors. Since Escherichia coli (E. coli) and other bacteria strains contain different surface compositions, their electrical oscillations should theoretically differ.
Unique electrical properties can also be seen from Akabuogu et al. (2024), where researchers conducted an experiment on a ‘wild’ E. coli strain and mutant strain to determine the difference in contact resistance. They found that the mutant strain was significantly higher in contact resistance (Rct) with 7500 Ω whereas the wild strain had 471 Ω. Rct is a measure of electricity as well, since the rate of exchange of charge on the interface of the electrode versus the biofilm is what is being measured, which directly applies to electricity as ion/charge exchange produces electrical signals (Akabuogu et al. 2024). It also proves that these electrical properties only exist in viable cells; after analyzing these results, a disinfectant was added and the electrical behaviour disappeared. This is evidence of a change in electrical responses due to the bacteria being killed, proving that the electrical oscillations only exist within living bacteria. The article emphasizes the importance of a control, such as agar, as without it, the cells would produce an inconsistent reading of electricity (Akabuogu et al., 2024).
Additionally, there was research conducted on the effects of metallic surfaces on bacteria to produce electrical changes. In an experiment conducted by Lyautey et al. (2011), researchers found that the majority of bacteria can promote electrical exchange when in contact with a metallic electrode. This demonstrates that circuits and aluminum electrodes are a valid and reliable source of measuring electrical signals. Furthermore, the study detected electroactivity across many groups of bacteria such as Actinobacteria and Proteobacteria. This is further evidence that different species of bacteria have unique electrical oscillations.
Researchers have found that bacteria interact using electrical signals in their biofilms (Masi et al., 2015). Scientists detected evidence that the electrical activity produced is not incidental, but rather electricity spiking was consistent within the same strain of bacteria so long as the growth state is the same (Masi et al., 2015). Moreover, different bacteria have varied amplitudes; for example, Bacillus licheniformis demonstrated a higher amplitude whereas a strand of non-biofilm forming E. coli showed miniscule changes (Masi et al., 2015). This finding contributes evidence for using biofilms as an amplifier for electrical signals. This is because electrical pulses become synchronized and unanimous as bacterial cultures grow, suggesting that the oscillations will become stronger over time. The amplitude in the experiment was influenced directly by the proximity of the biofilms to the electrode, highlighting the importance of direct contact between the bacteria cultured and the electrodes.
Bacteria are often studied through visual measurements or genetic testing, while this research focuses on electrical oscillations. Using electrical signals may offer a more reliable, timely, and cost-effective form of measurement. This electrical behaviour can be found through a multitude of measurements including conductivity, current, voltage and impedance. Among these, voltage oscillations allow for a comparison of activity over a span of time rather than relying on static measurements. This grants the ability to concentrate on dynamic activity, forming more dependable results as each trial can produce numerous voltages. Using three bacterial species allows for control and comparison of each species with a higher degree of precision. To limit variables that must be controlled and measured, using a simple model with agar, an aluminum electrode, and a multimeter gives clearer interpretations. Previous studies show limited evidence for whether less complex and voltage-based results have the potential to reveal distinguishable electrical oscillations between different bacterial species. The aim of this experiment is to explore whether there are distinct patterns in electrical signals between different bacterial species and not to simply identify bacteria through electricity. This research is important for a variety of reasons, including contributing to the understanding of bacteria and its interactions with physical systems. It shows that there is a non-invasive form of monitoring species without using destructive samplings or staining.
Materials and Methods
Bacterial Suspension Protocol:
A 0.9% saline solution was prepared by adding 0.135g NaCl to 15ml of distilled water. Three to five colonies were touched with a sterile loop from a countable plate (~25 – 250 CFU). The collected bacteria were then suspended in 1.5ml of the saline solution in a microcentrifuge tube. The isotonic saline solution was used to prevent E. coli cells from bursting. The suspension was then vortexed, and the process was repeated for each bacteria species.
Plating Protocol:
A 100µl solution of the suspension was pipetted onto an agar plate. The suspension was then evenly spread across the plate by twisting a sterile L-spreader back and forth while the plate was continuously turned. The inoculum was absorbed into the agar plates for 10-20 minutes. The plates were inverted and then incubated for 2-3 days until a biofilm was formed, E. coli at 37°C, B. cereus at 30°C, and P. putida at 25°C, which are the optimal temperatures for growth for each species.
Voltage, Current, and Resistance Measurements:
After the bacteria was incubated, two aluminum electrodes were inserted vertically on opposite edges of each bacterial plate. Placing the electrodes on each side of the agar plate allows for the electrical signals being measured to be from the biofilm in its entirety and not from individual colonies as that could potentially change the results. The electrodes were positioned against the sides of the agar plate. A digital multimeter (VICTOR VC830L) was connected using leads to the aluminum electrodes to measure the voltage, current, and resistance. Voltage was measured in 200mV, current was measured in 20µA, and resistance was measured in 20MΩ. The process was recorded next to a stopwatch for 1 minute and 30 seconds to ensure accuracy. Data samples were taken every 3 seconds.
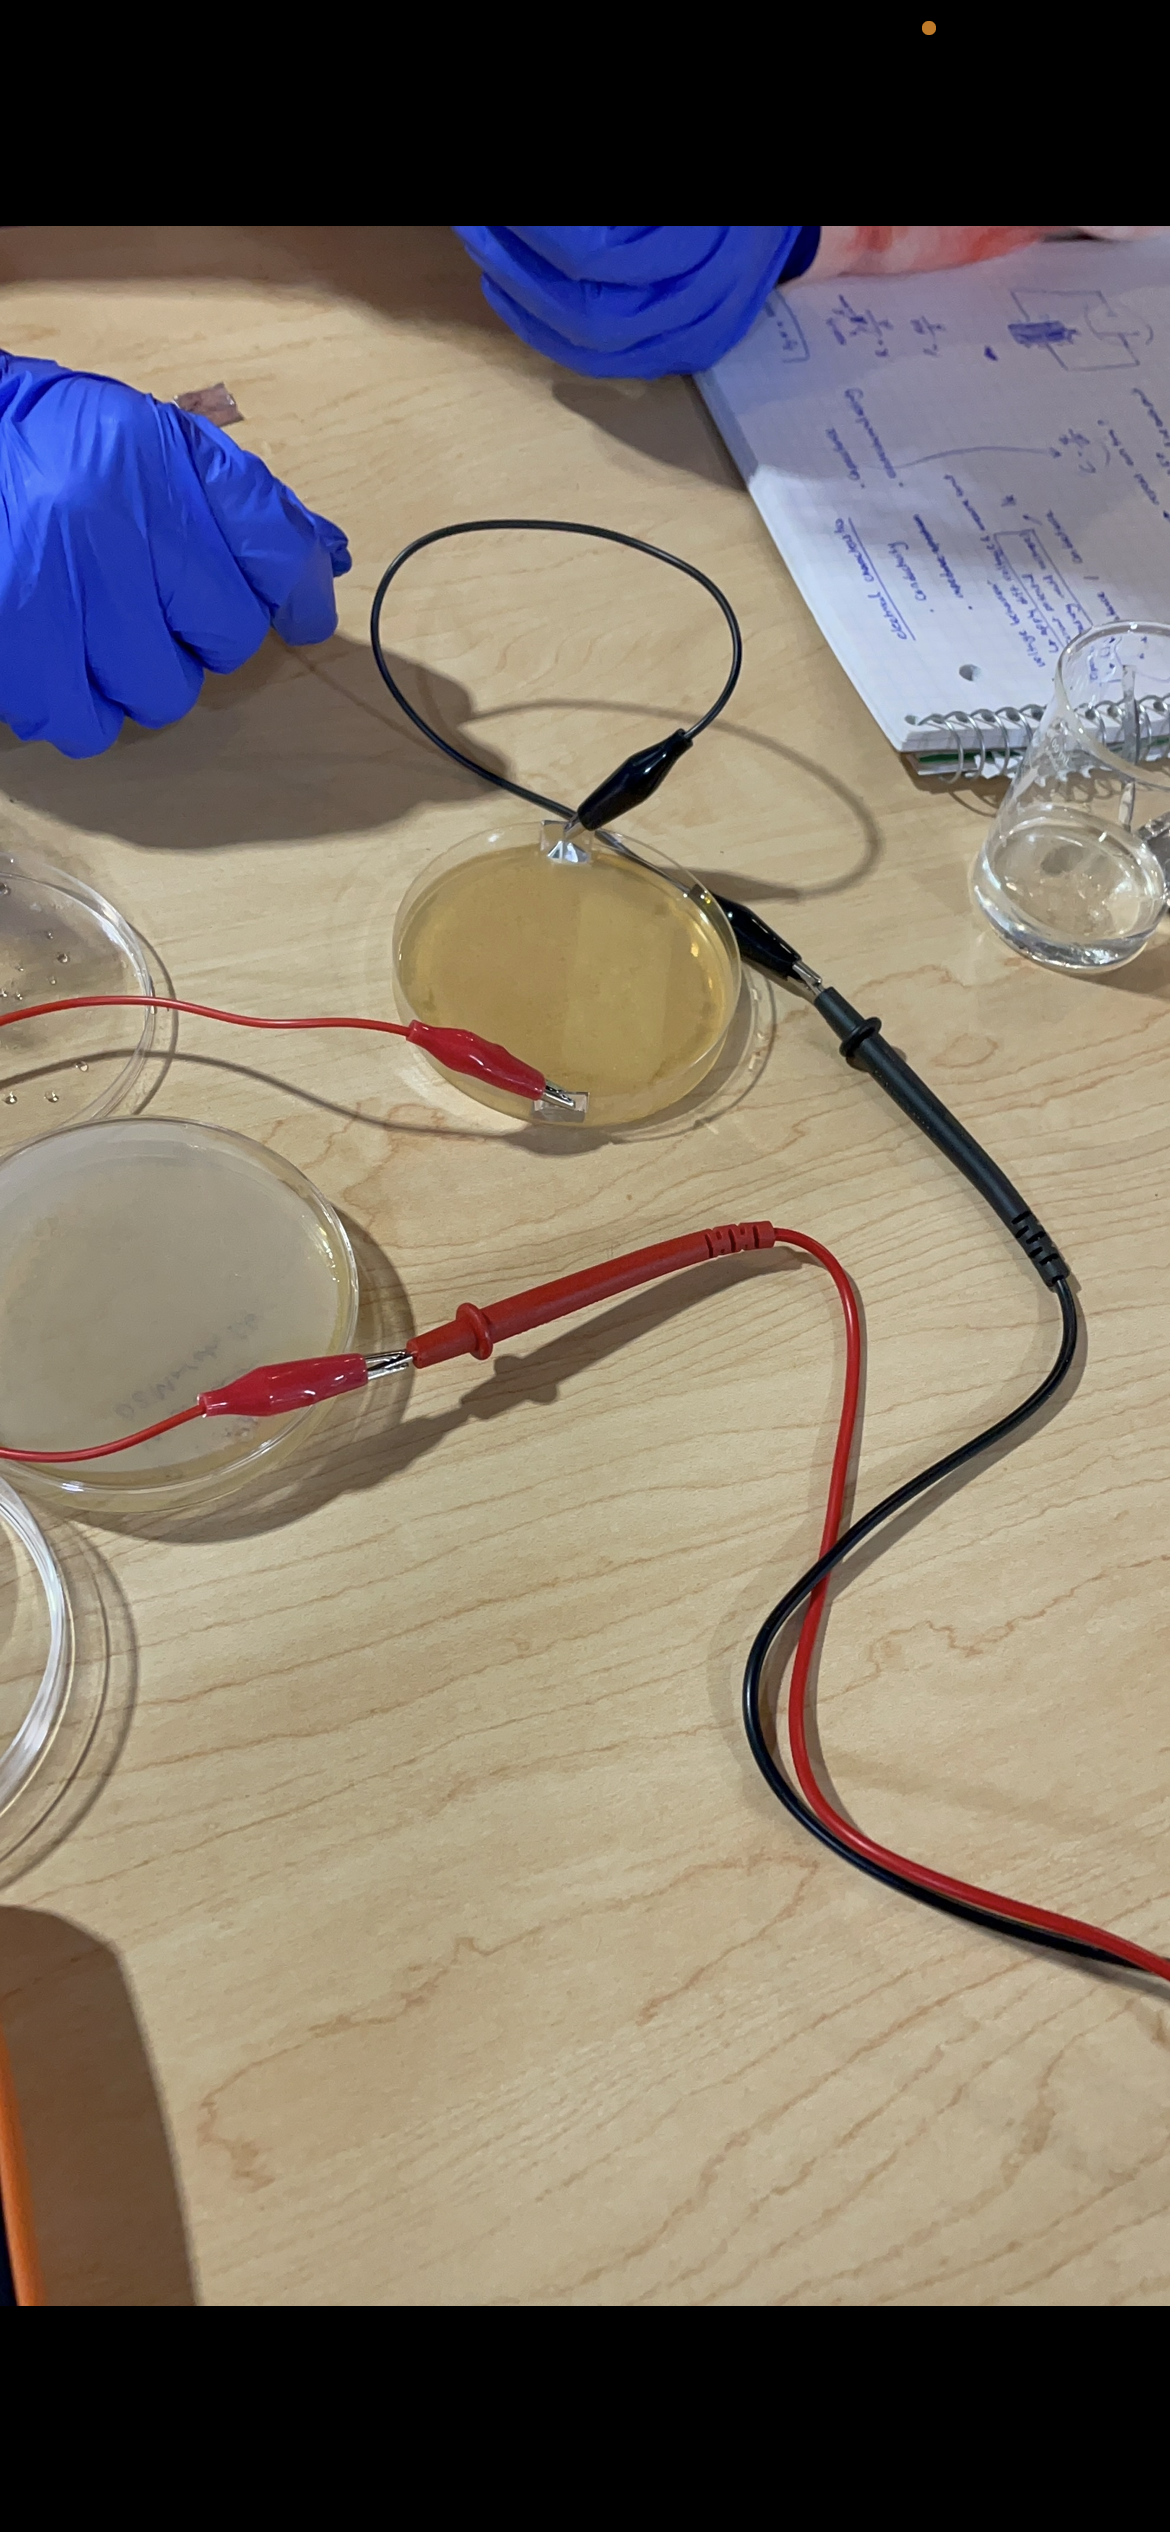
Figure 1: Voltage measurement being taken in the agar plate
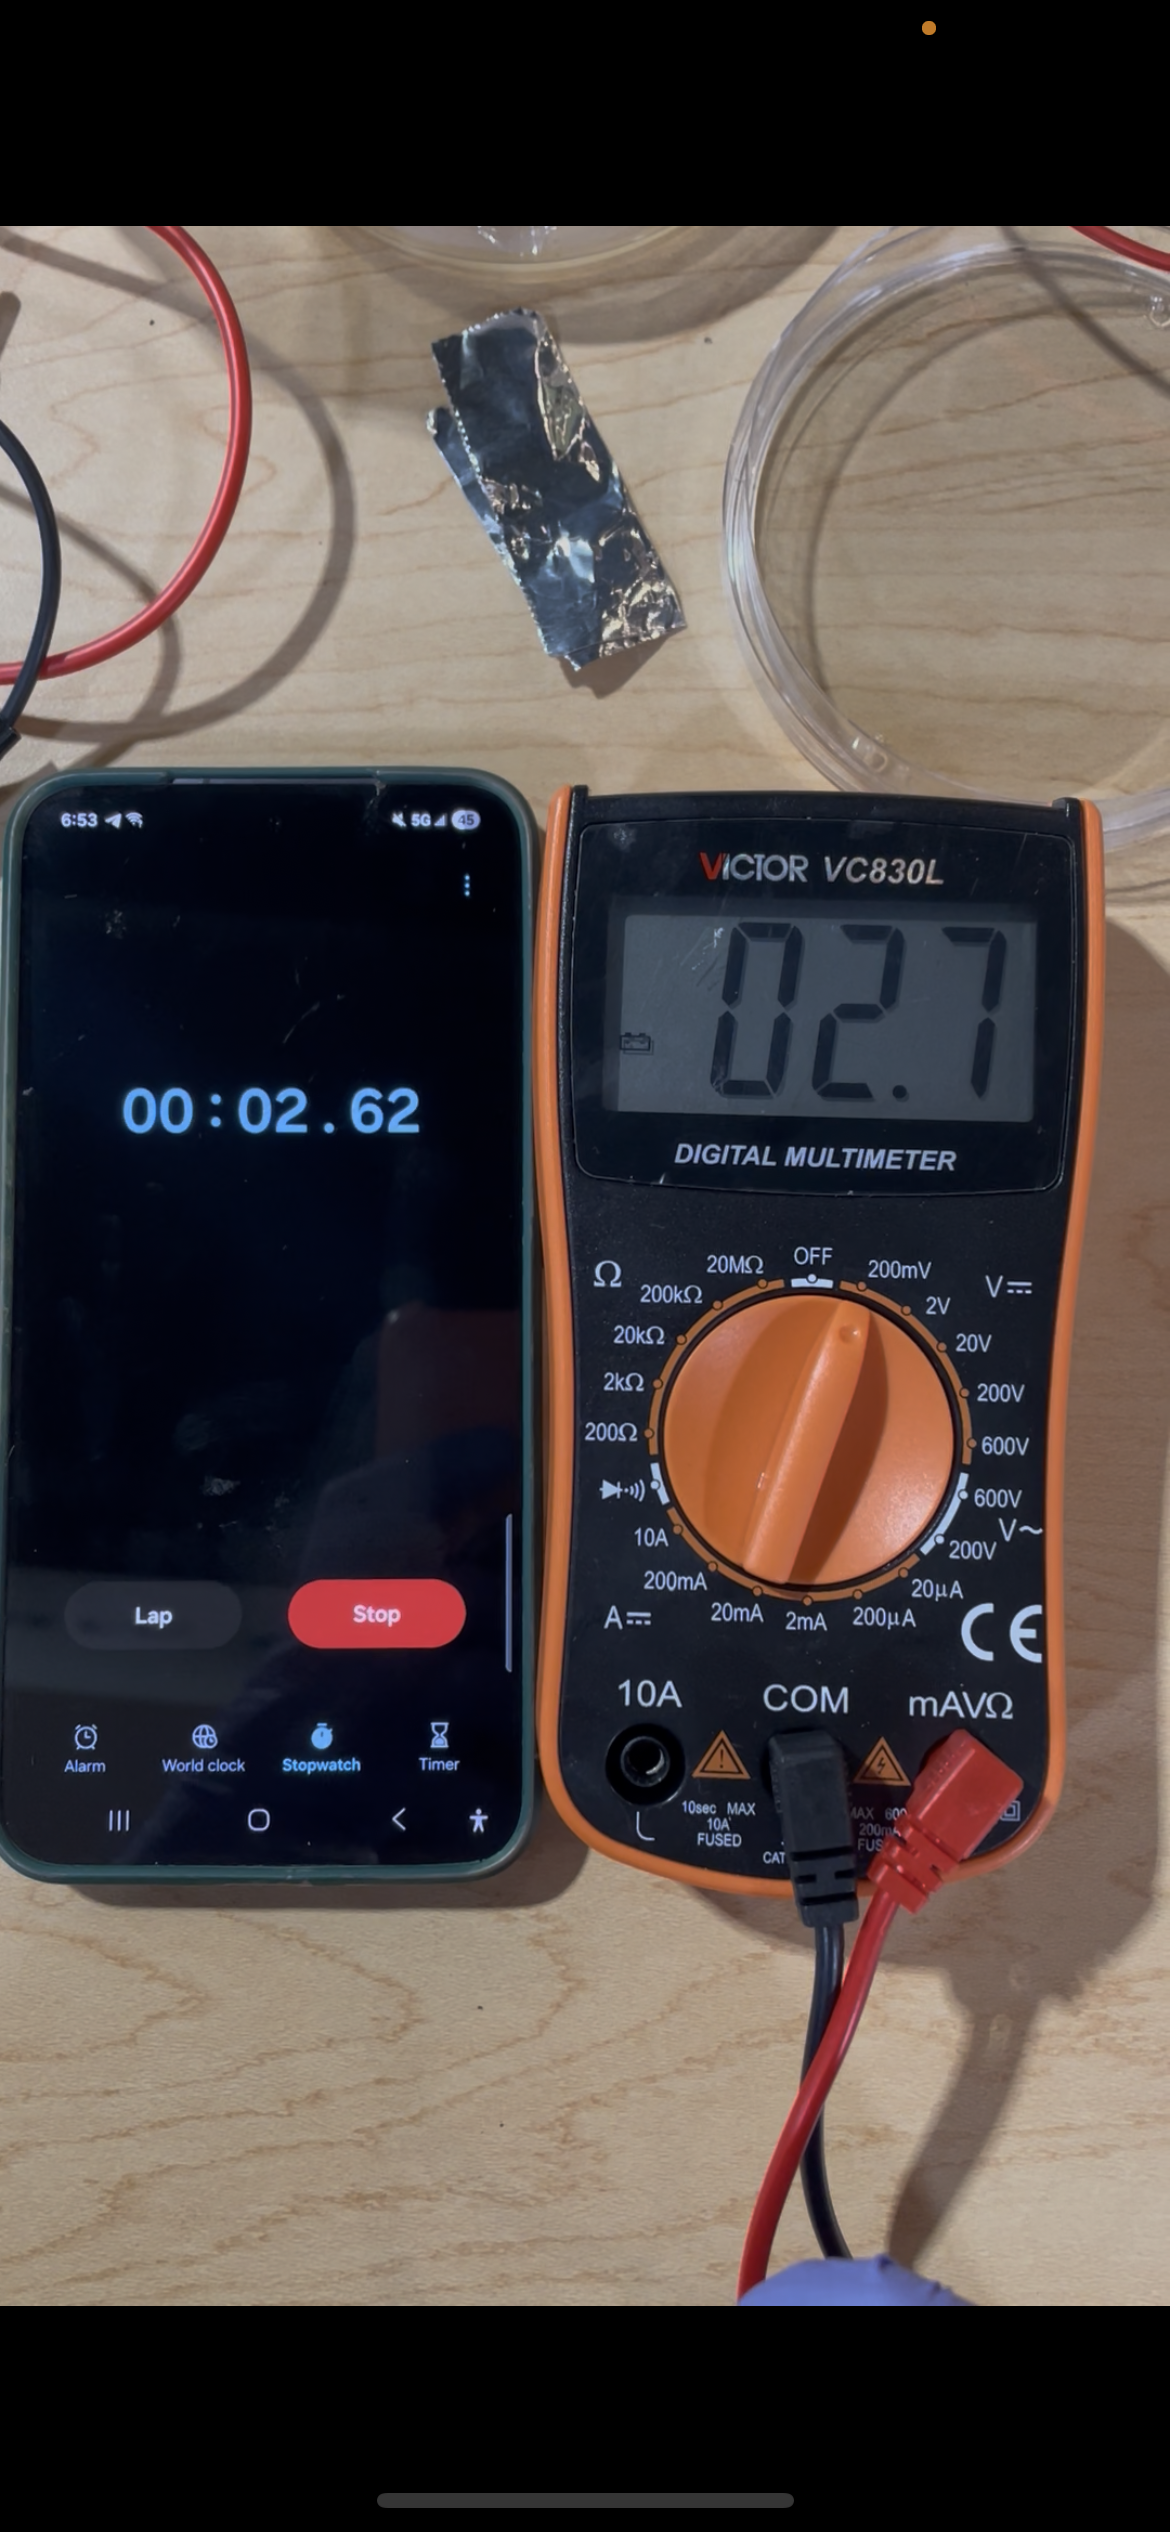
Figure 2: Voltage being measured in E. coli with multimeter and stopwatch
Results
To test E. coli, P. putida, and B. cereus’s electrical oscillations, the bacteria species were measured for voltage, current, and resistance using a digital multimeter every 3 seconds. The voltage measurements had variation across all bacteria, with noticeable differences between bacterial species. E. coli exhibited higher voltage values on average, with the multimeter readings fluctuating between 16.2-67.2 mV, and the average result being 45.12 mV. P. putida displayed results between 0-57.7 mV, with the average being 21.2 mV, and had shown multiple spikes in numbers, hence the large range. B. cereus results ranged from 0.7-55.4 mV, with the average being 16.3 mV. The agar control produced the lowest voltage on average at 14.6 mV with a range of 0.1-45.7 mV and few large fluctuations.
The currents measured showed differences in consistency: E. coli, was relatively consistent with the average being 0.58 µA. P. putida had much larger fluctuations and the average was 0.47µA. B. cereus also had some fluctuations; the average was 0.32 µA.
Resistance among the agar control plate was consistent, with a 0.07 MΩ average. E. coli had an upwards trend in resistance; the average was 0.7 MΩ. P. putida demonstrated an irregular resistance pattern, with the average being 0.35 MΩ, however a large range of results. Lastly, B. cereus demonstrated an increase in resistance with the average being 0.83 MΩ.
Table 1: Voltages (200mV) average, standard deviation, and range among each bacterial species
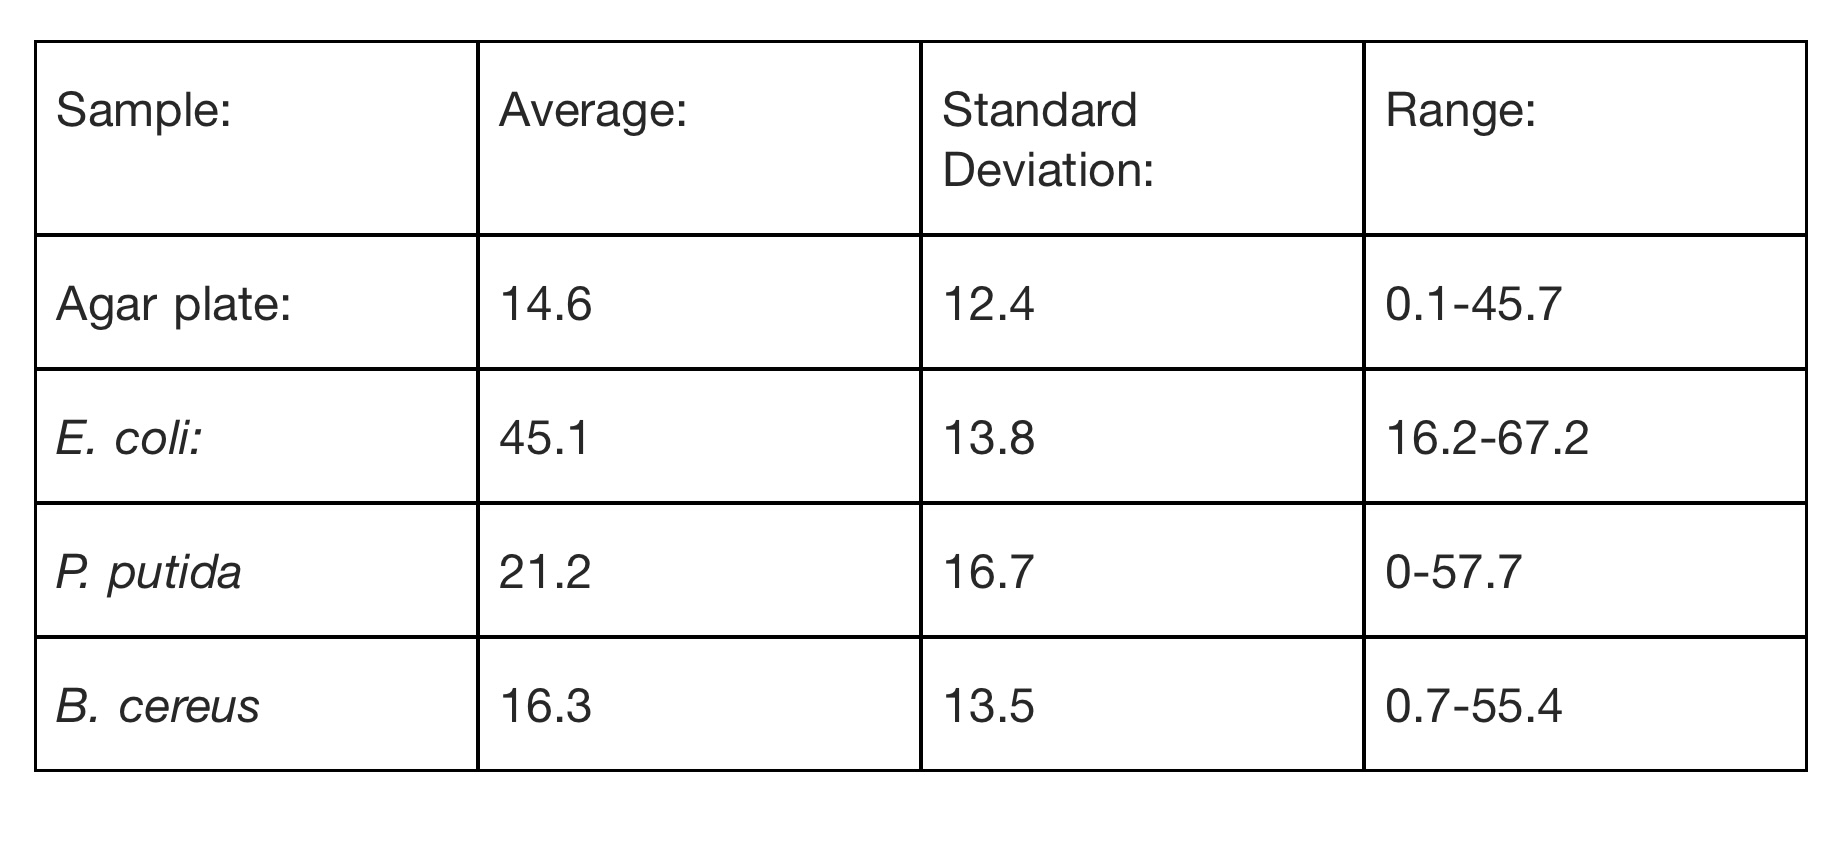

Figure 3: Voltages (200 mV) collected for the agar plate, E. coli, P. putida, and B. cereus
Table 2: Current (20µA) average, standard deviation, and range among each bacterial species

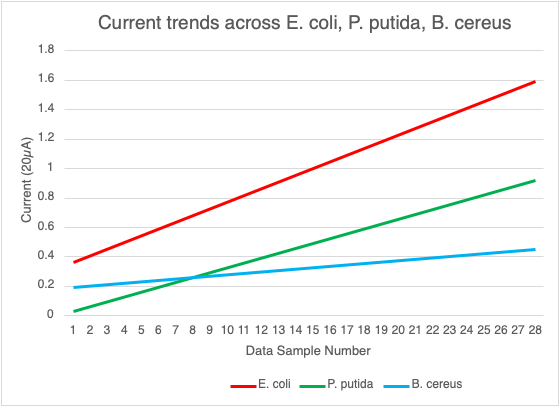
Figure 4: Current (20µA) trends among each bacterial species
Table 3: Resistance (20MΩ) average, standard deviation, and range among each bacterial species
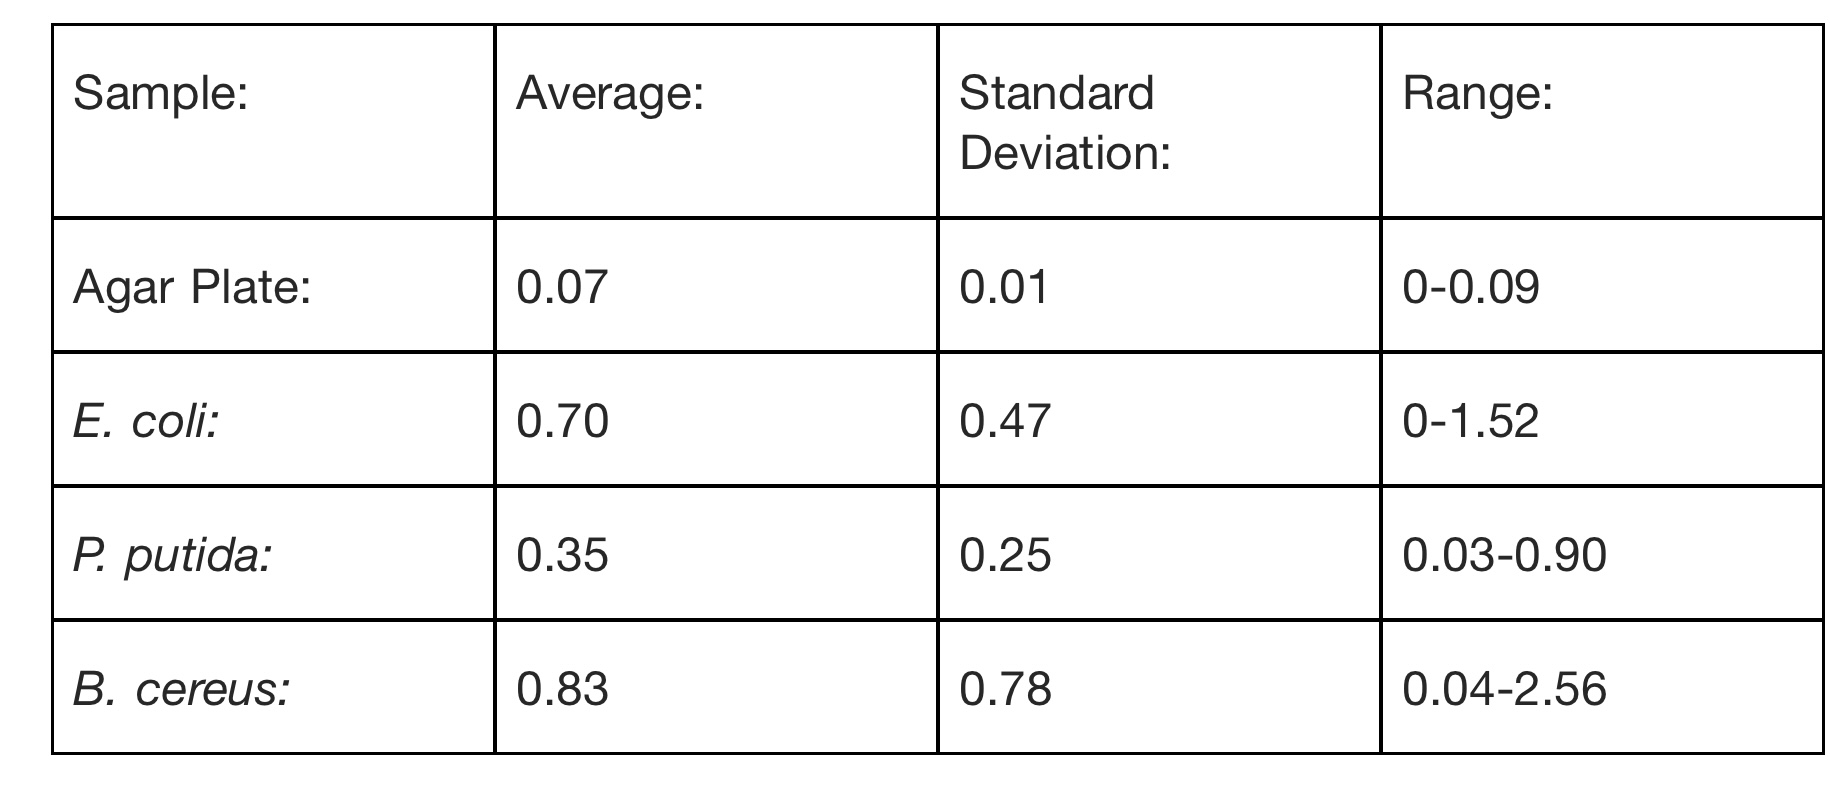
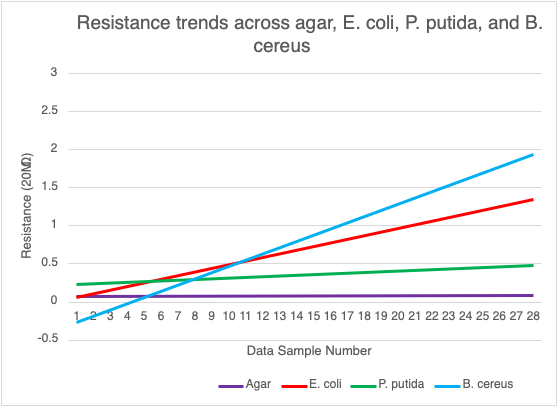
Figure 5: Resistance (20MΩ) collected for the agar plate, E. coli, P. putida, and B. cereus
Discussion
The results of this experiment demonstrate that each bacteria species exhibited different electrical behaviours. E. coli had the highest voltage (45.1 mV) with a relatively consistent upwards trend and was substantially different from the P. putida results, for example. P. putida had lots of variability in its voltage, with a 16.7 standard deviation and a 21.2 mV average. Overall, each bacteria had distinct averages and patterns within their electrical oscillations. When using the trends of the data, one could potentially determine the species between E. coli, P. putida, and B. cereus.
The difference in electrical patterns is likely due to the biological characteristics of each bacteria species. E. coli’s results demonstrate a more stable ion exchange within the agar plate, whereas P. putida displays large fluctuations which can suggest a less stable ion exchange. These results remain consistent with those of Guliy et al. (2022), which found that cells’ charge distribution and surface composition influenced electrical oscillations. Furthermore, the observed increase in resistance of E. coli and B. cereus, and more constant resistance of the agar control plate, aligns with Akabuogu et al. (2024) which states that electrical resistance is also dependent on the cell’s interaction with electrodes and their biofilm. The resistance results observed in this experiment indicate that the bacteria itself influence the resistance and voltages. Additionally, the fluctuations and spikes seen in the data support the research by Masi et al. (2015) as these ranges in results can show the electrical activity within biofilms. Bacterial communities are able to synchronize, which can amplify electrical oscillations (Masi et al., 2015). These results gained in this experiment suggest that electrical properties can provide a better understanding of bacterial species, growth development, and charge movement. Overall, different bacterial species do show some distinct patterns in terms of voltage, current, and resistance.
In this experiment, there were multiple limitations. Firstly, the multimeter tool used, the VICTOR VC830L, could only measure 3 digits. This means that any subtle oscillations or changes will not have been detected. Secondly, there were only 3 species of bacteria used. In order to determine the true extent of whether electrical oscillations can be used to distinguish between species, more than 3 species should be used. Additionally, the initial electrode used was made from copper, however, because of copper’s anti-bacterial properties, aluminum was used instead. The electrode metal used could impact the electrical oscillations since different metals have distinct conductive properties that interact differently with bacterial samples. Lastly, due to time restraints, only one trial was completed for each bacterial species. This means that if there were any outside factors that impacted the bacteria, the results would not reflect this. More trials are needed to ensure accuracy.
Future works include using more bacterial species to compare results to determine whether bacteria can be distinguished from electrical oscillations alone. Another extension of this project includes measuring biofilm thickness to research how the thickness impacts the electrical oscillations given. Lastly, an expansion of this project could be to use different electrode materials to determine how distinct electrodes can influence the oscillations measured.
The findings in this study indicate that electrical measurements can display biological processes like biofilm development and ion exchange, which aligns with previous research on electricity in bacteria. The ability to distinguish between species with electrical oscillations demonstrates a potential use in biosensors where they can provide a non-invasive form of measuring. However, due to the limitations in this experiment, further research with more advanced instruments and a larger range of species is required to ensure whether voltages within bacteria are distinguishable.
References
Akabuogu, E., Cunha Martorelli, V. C. D., Krašovec, R., Roberts, I. S., & Waigh, T. A. (2025, March 21). Emergence of ion-channel-mediated electrical oscillations in Escherichia coli biofilms. eLife. Retrieved October 26, 2025, from https://elifesciences.org/articles/92525#content
Beyond Pesticides Staff. (n.d.). Nanosilver: Health Effects. Beyond Pesticides. Retrieved October 26, 2025, from https://www.beyondpesticides.org/resources/antibacterials/nanosilver/health-effects#:~:text=While%20silver%20nanoparticles%20are%20considered%20to%20have,cells%20by%20attacking%20DNA%2C%20proteins%20and%20membranes
Mehrotra, P. (2016, January 6). Biosensors and their applications – A review. National Library of Medicine. Retrieved April 22, 2026, from https://pubmed.ncbi.nlm.nih.gov/27195214/
Prindle, A., Liu, J., Asally, M., Ly, S., Garcia-Ojalvo, J., & Süel, G. M. (2015, October 21). Ion channels enable electrical communication within bacterial communities. National Library of Medicine. Retrieved October 26, 2025, from https://pmc.ncbi.nlm.nih.gov/articles/PMC4890463/
Widatalla, H. A., Yassin, L. F., Alrasheid, A. A., Ahmed, S. A. R., Widdatallah, M. O., Eltilib, S. H., & Mohamed, A. A. (2022, January 18). Green synthesis of silver nanoparticles using green tea leaf extract, characterization and evaluation of antimicrobial activity. National Library of Medicine. Retrieved October 8, 2025, from https://pmc.ncbi.nlm.nih.gov/articles/PMC9419201/