Liam Kennedy — Year 2, Applied Science
Abstract
Carrot agriculture produced over 40 million tonnes world-wide in 2022, yet 12.57% of carrots grown each year are thrown out because they are defective, over-ripe, or under-ripe. This study aimed to create a Convolutional Neural Network (CNN) to classify carrot ripeness from an image of the pre-harvest plant. 4636 images were taken of 159 carrots from different angles and orientations and used to train the AI model. The CNN was created to classify carrot images as either ripe or under-ripe from an 100×150 pixel image. The CNN was trained with 6 different learning rates and 6 different batch sizes. The highest performing model had an accuracy of 85% with a learning rate of 0.00005 and a batch size of 64. This shows that an AI model could accurately classify carrot ripeness from an image of the pre-harvest plant to a high degree of accuracy.
Introduction
Context
In 2022, 41 million tonnes of carrots were produced world-wide (Liong et al. 2023). According to Pietrangeli and Cicatiello (2024), 12.57% of carrots grown each year are thrown out because they are unfit to eat. This loss consists of defective, over-ripe, and under-ripe carrots. Additionally, back-yard gardeners can easily mis-judge carrot maturity and harvest at the wrong time. Ripeness classification is crucial for food industries to provide the best possible product for consumers (Mukhiddinov et. al. 2022).
The field of artificial intelligence (AI) in agriculture is relatively new. Most of the research in this field was conducted in the past 5 years. In this time, widespread research has been conducted in the use of AI with agriculture including food type classification and pre- and post-harvest ripeness determination. Yet, as a new area for study, there are still areas in agriculture with minimal research into AI.
AI Models
Many different types of AI models have been used in studies concerning the use of AI in agriculture. One popular model is a Convolutional Neural Network (CNN), a structurally large and complex model strong at object detection and feature classification. A simpler and slightly more lightweight model is an Artificial Neural Network (ANN), which is more versatile and also performs well at both object detection and feature classification. The You Only Look Once (YOLO) model is an extremely lightweight model that is good at object detection but prioritises speed over accuracy.
Activation functions are used within almost all AI models to create non-linear relationships between layers of the neural network. Examples include the computationally efficient ReLU function, the slightly more complex Mish function, and the SoftMax function which can help normalize outputs. AI models are evaluated using different types of performance metrics, such as accuracy, specificity, precision, recall, and F1-score.
Literature review
Mukhiddinov et al. (2022) developed a general fruit and vegetable image classifier with 10 different classes. The study used a YOLOv4 model using the Mish activation function as their background framework to minimize the network’s size. Their intention was to help visually impaired people interact with food, so they used images in real environments. They started with 12,000 images with varied backgrounds, lighting, and image sizes. Using both pixel and spatial image augmentation, they increased the number of images to 43,000 to create a robust data set. The authors used 80% of their data to train the model and split the rest evenly to testing and validation. They tested the model using accuracy and precision. The best result they attained was 72.5% precision, which is understandable since the images used had complex backgrounds. Their YOLOv4 model was also lightweight as intended, so it could be easily used on a smartphone or smart glasses.
Tapia-Mendez et al. (2023) studied the use of AI in both fruit and vegetable image classification and freshness identification. They created two CNNs: one to classify what type of fruit or vegetable was in the image (32 possible classes), and one to classify the ripeness (fresh or rotten) of each produce. While Mukhiddinov et al. (2022) used images in real-life environments, Tapia-Mendez et al. (2023) used clean images on white backgrounds. They used input images of 512 x 512 pixels (Tapia-Mendez et al. 2023). Alike to Mukhiddinov et al. (2022), they used 80% of their images to train the CNN with the remaining 20% split evenly into testing and validation. To find the success of the two CNN models, they tested each CNN with accuracy, precision, and F1-score. Their model achieved an accuracy of 97.86% in fruit and vegetable classification and an accuracy of 100% in ripeness classification. Since the images used were on a white background, these results could be unrealistic in a real-life setting, and their model could be hard to adapt into a usable product. However, their CNN model could help automate food production by determining food freshness post-harvest.
Zhao et al. (2023) examined apple detection and ripeness determination, in a study focused on just one type of fruit. They used a YOLO-World model to find the individual apples from 2530 images of apple trees. This produced 7191 images of apples of sizes 224 x 224 pixels and 112 x 112 pixels. Using the apple images, the authors created a ripeness predictor model using a simple 3-layer ANN with a ReLU activation function. Unlike Tapia-Mendez et al. (2023) who classified freshness as fresh or rotten, Zhao et al. (2023) produced a scale of ripeness from 0 to 1. The multi-step model developed by Zhao et al. (2023) could improve pre-harvest apple farming by fully automating apple harvesting and reducing waste by picking each apple at its ripest.
Deng et al. (2021) studied carrots, developing a reliable automatic carrot defect grading system for post-harvest. Their goal was a quick processing time, so they developed a modified lightweight CNN to process 40 carrots per second. They constructed a conveyor belt set-up to feed the carrots past the camera, which took in photos at a size of 214 x 214 pixels. The model detected 5 different types of defects as well as classified the carrot size into 4 different groups. They tested the model with 5 different batch sizes on 10 epochs and tried learning rates from 0.05 to 0.00001. The authors evaluated the model using accuracy, precision, specificity, recall, and F-1 score. Their best result was an accuracy of 93.0% defect classification and 95.1% size classification using a learning rate of 0.0005. Deng et al. (2021) intended this lightweight CNN model to help carrot sorting by automatically grading and sorting carrots at market level, keeping the same standards throughout different processors.
Likewise, Liong et al. (2023) studied post-harvest carrot sizing. They created an automated system using different AI models that determined the size of randomly placed carrots on a conveyor belt (Liong et al. 2023). Using a YOLOv4 model, a CNN, and an ANN, their system estimated each carrot’s real-life dimensions and volume. They gathered 3120 images in 10 videos from 20 carrots at 640 x 480 pixels with different lighting conditions. The authors trained the CNN using 90% of the data with the remaining used for testing. Similar to Mukhiddinov et al. (2022) and Tapia-Mendez et al. (2023), Loing et al. (2023) trained the ANN using 80% of the data with the rest split between testing and validation. They tested the performance of the object detection using recall, precision, and F1-score with less than 100 epochs and a learning rate of 0.00001. The combined YOLOv4, CNN, and ANN system developed by Liong et al. (2023) could be used to automate carrot sorting like the system developed by Deng et al. (2021).
Research Gap
Studies have developed AI classifiers for many types of fruit and vegetables, such as Tapia-Mendez et al. (2023) and Mukhiddinov et al. (2022). Pre-harvest ripeness determination using AI has been studied with apples by Zhao et al. (2023). Post-harvest carrot sizing and defect grading using AI was studied by Deng et al. (2021) and Liong et al. (2023). However, to the best of the author’s knowledge, no studies have developed a pre-harvest carrot ripeness classifier using an AI model.
This study intends to create and test an AI model to classify carrot ripeness from images of the pre-harvest plant. The model will be tested with different learning rates and batch sizes to determine the highest performance it can achieve. A CNN was chosen for this study largely because results in prior agriculturally studies by Tapia-Mendez et al. (2023) and Deng et al. (2021) showed its success in image classification. The CNN model is specialized in image processing, making it a logical choice for a model to detect ripeness from an image.
Methods
Image Collection
Napoli Carrots (West Coast Seeds CR277) were planted in June and July 2025 in four garden beds (Figure 1). The carrots were picked gradually between Aug. 11 and Oct. 1. On the days that carrots were picked, an average of five carrots were picked with a range of one to 18. A total of 159 carrots were photographed and harvested. A total of 4636 images of pre-harvest carrot plants were taken. The average number of images taken per pre-harvest carrot plant was 30. Images of each pre-harvest carrot plant were taken at different angles, positions, and orientations (landscape and portrait) before it was picked (Figure 2). Post-harvest carrots were photographed alongside a ruler to capture carrot length (Figure 3). According to the West Coast Seeds Gardening Guide (2025), Napoli Carrots mature to 12 – 17 cm. Therefore, in this study, a carrot was considered ripe if it was more than or equal to 12 cm in length and a carrot was considered under ripe if it was less than 12 cm.
A custom PyTorch Dataset was created to manipulate and store the carrot images which were all in the RGB colour space. Each image was resized to 100 x 150 pixels. Each image was also normalized using a mean of [0.47, 0.49, 0.47] and a std of [0.25, 0.28, 0.25] using the equation:
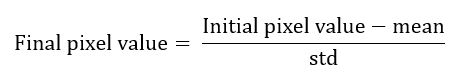
all for each colour. A custom data loader was created to feed the model batches of images as needed. A random 80% of the images (3707 images) were designated as training data. The remaining 20% (927 images) were designated as testing data.
Creating the Model
The CNN model was built using the PyTorch library. The initial base hyper parameters were: network shape, activation function, loss function, optimizer, and dropout rate. These hyper parameters were decided on based on the accuracy score of different tests of the network. When the model was trained over 200 epochs, the model performed best between 75 – 125 epochs. For this reason, the number of epochs was decided to be 100. The neural network had an input layer of 100 x 150 (the size of the input image). It then had three blocks of layers each consisting of a convolutional layer, ReLU activation layer, and pooling layer. It then had three fully connected layers, using the ReLU activation function, with sizes of 60000, 750, and 250 neurons respectively. The neural network had an output layer of two neurons representing either a ripe or under ripe prediction (Figure 4). The Cross Entropy Loss function was used to calculate the loss of the network. The PyTorch Adam optimizer was used to train the network’s parameters using a weight decay of 0.000001. To reduce overfitting, dropouts were used at p=0.5 (50%) before the last two fully connected layers. The model was trained using the designated training data and tested using the separate testing data.
Training the Model
The CNN was first trained with a batch size of 64 and six different values for the learning rate: 0.0005, 0.0001, 0.00005, 0.00001, 0.000005, and 0.000001. The value that resulted in the highest testing accuracy was 0.00005. With that learning rate, the CNN model then was tested with five different batch sizes: 128, 94, 64, 32, and 24.
Results
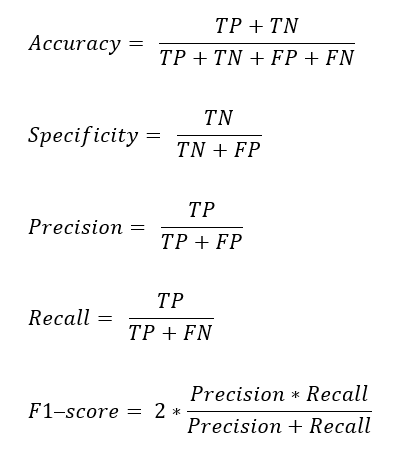
The models were evaluated using 5 different performance metrics: accuracy, specificity, precision, recall, and F1-score. Each metric measured the model’s performance in a specific area. The performance metrics were calculated from the model’s true positives (TP), true negatives (TN), false positives (FP), and false negatives (FN):
Six different models were trained with a batch size of 64 and different learning rates (Table 1). The model with a learning rate of 0.00005 had the highest testing accuracy of 85%.
Table 1: Performance metrics of the CNN across six learning rates with a batch size of 64

With this learning rate of 0.00005, 4 more models were trained and tested with different batch sizes (Table 2). The models with batch sizes of 64 and 32 had the same accuracy, but the model with a batch size of 64 had a higher F1-score (which blended between precision and recall), so it was considered the highest performing model (Table 3).
The accuracy of the six models trained with different learning rates peaked at 85% with a learning rate of 0.00005, and the accuracy continuously decreased when the learning rate was higher or lower than that value. The accuracy of the five models trained with different batch sizes peaked at 85% with a batch size of 64 or 32. When the batch size was decreased, the accuracy decreased to 52%. When the batch size was increased, the accuracy slightly decreased to 83%, but did not decrease further.
Table 2: Performance metrics of the CNN across five batch sizes with a learning rate of 0.00005

Table 3: Confusion Matrix of classification of carrot ripeness using results from the highest performing CNN (0.00005 learning rate and a batch size of 64).

Discussion
Multiple photos were taken of 159 ripe or under ripe carrots. These were used to train a neural network to classify carrots as ripe or under ripe from an image. The highest performing model achieved a testing accuracy of 85%; the model was trained on a learning rate of 0.00005 and had a batch size of 64.
The results showed that the model created was successful in classifying pre-harvest carrot ripeness from an image. The model achieved an 83% chance of correctly classifying an unripe carrot, and an 86% chance of correctly classifying an unripe carrot. This strikes an acceptable balance between ripe and unripe classification.
The other model which achieved an accuracy of 85% had a batch size of 32. This model achieved a 79% chance of correctly classifying a ripe carrot, but a 90% chance of correctly classifying an unripe carrot. This model prioritised classifying unripe carrots, so its ripe classifications suffered. This is why it was rejected in favour of the selected model. However, this model could be useful if the user wished to avoid false positives (predicting a carrot is ripe when it is not) more than false negatives (predicting a carrot is not ripe when it is). If a carrot grower would prefer picking a carrot late than picking it early, then minimizing the false positives could be the correct choice. Nevertheless, for more general consumers, the model balancing the false positives and false negatives could be the most helpful.
This study showed that a CNN is an option to classify pre-harvest carrot ripeness. This further proves the usefulness of a CNN shown by the studies conducted by Tapia-Mendez et al. (2023) and Deng et al. (2021). The images used in this study had complex backgrounds alike to Mukhiddinov et al. (2022) and still achieved a relatively high accuracy. Unlike other studies, an image size of 100×150 was used. This is much smaller than the image sizes that prior studies have used, such as 512×512 by Mukhiddinov et al. (2022) and 214×214 by Deng et al. (2021). The small image size was mainly decided on by processing power limitations, but the network still reached an accuracy of 85%.
This study had multiple potential sources of error. The carrot images were taken from random positions, which could have caused potential error. This was intentional however, as the images were meant to reflect real world environments and scenarios. The CNN model had the limitation that it could only classify images with one carrot each. The model also overfit the training data with a 100% training accuracy, despite the steps taken to prevent it. This meant that the model partially memorized the training data instead of finding generalizations.
There are different ways follow-up studies could improve upon this paper. Additional pre-harvest carrot images could be collected and added to the data set, which could also improve the model’s performance by reducing overfitting. Better computers and higher processing power could allow a larger network, or larger input images which could also improve the model’s performance. A second model could be trained to isolate different carrot plants in the same image and then send each individual carrot to the first model to determine its ripeness, similar to Zhao et al. (2023) and Liong et al. (2023). This would allow multiple carrots to be in each image.
In conclusion, this study suggests that an AI model, specifically a CNN, can be used to classify pre-harvest carrot ripeness from an image to a high degree of accuracy. An application of this model could be widely used from increasing large scale harvest yields to assisting individual gardeners.
Figures
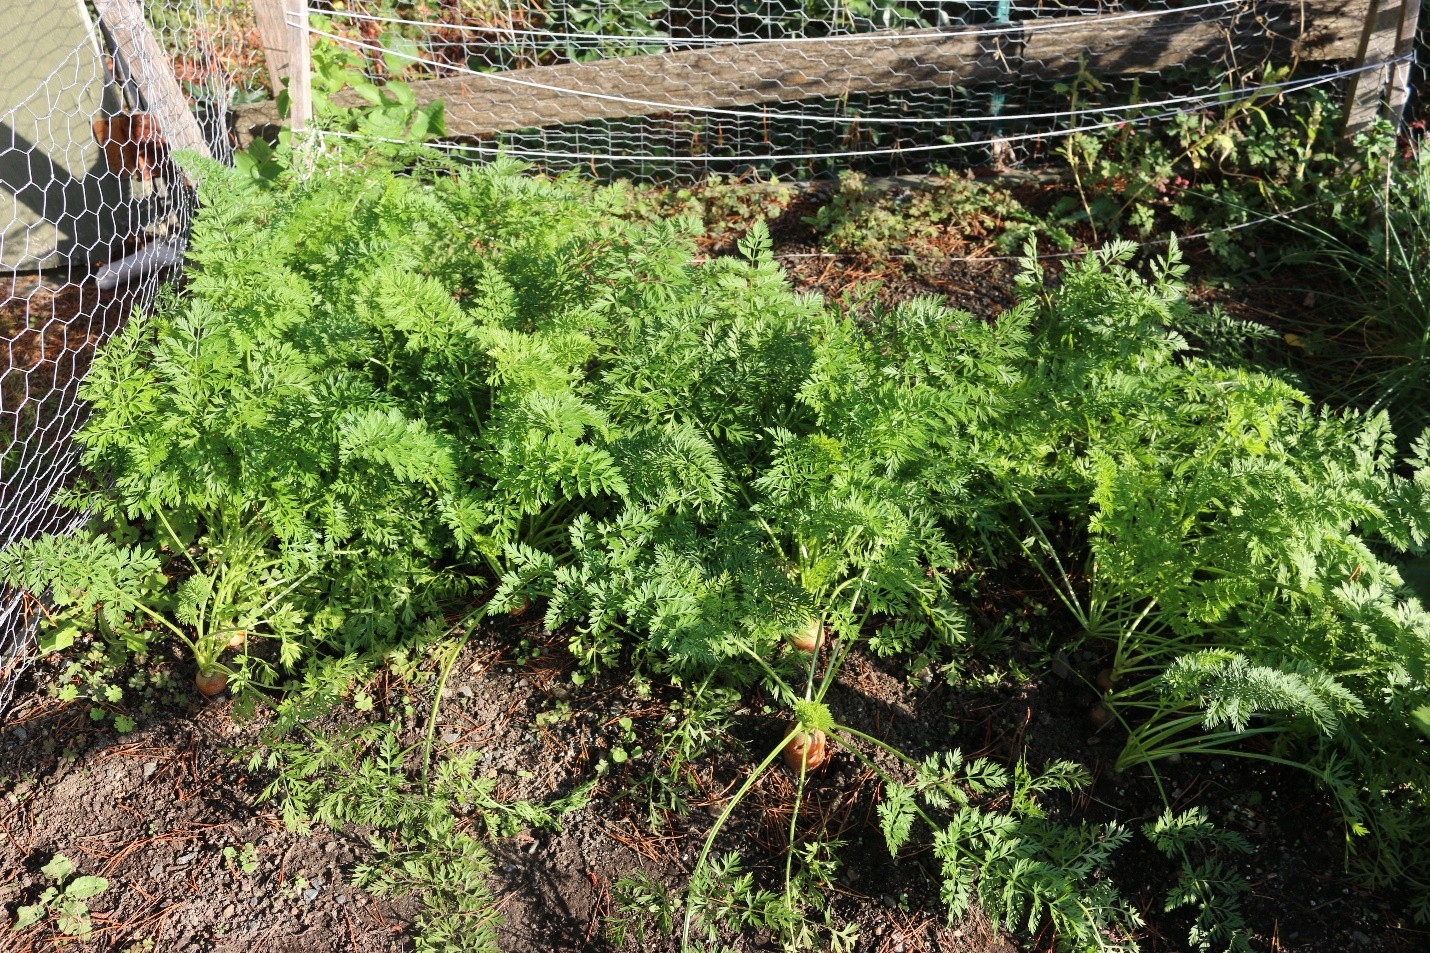
Figure 1: One of the four carrot beds used (This bed was already partially harvested)
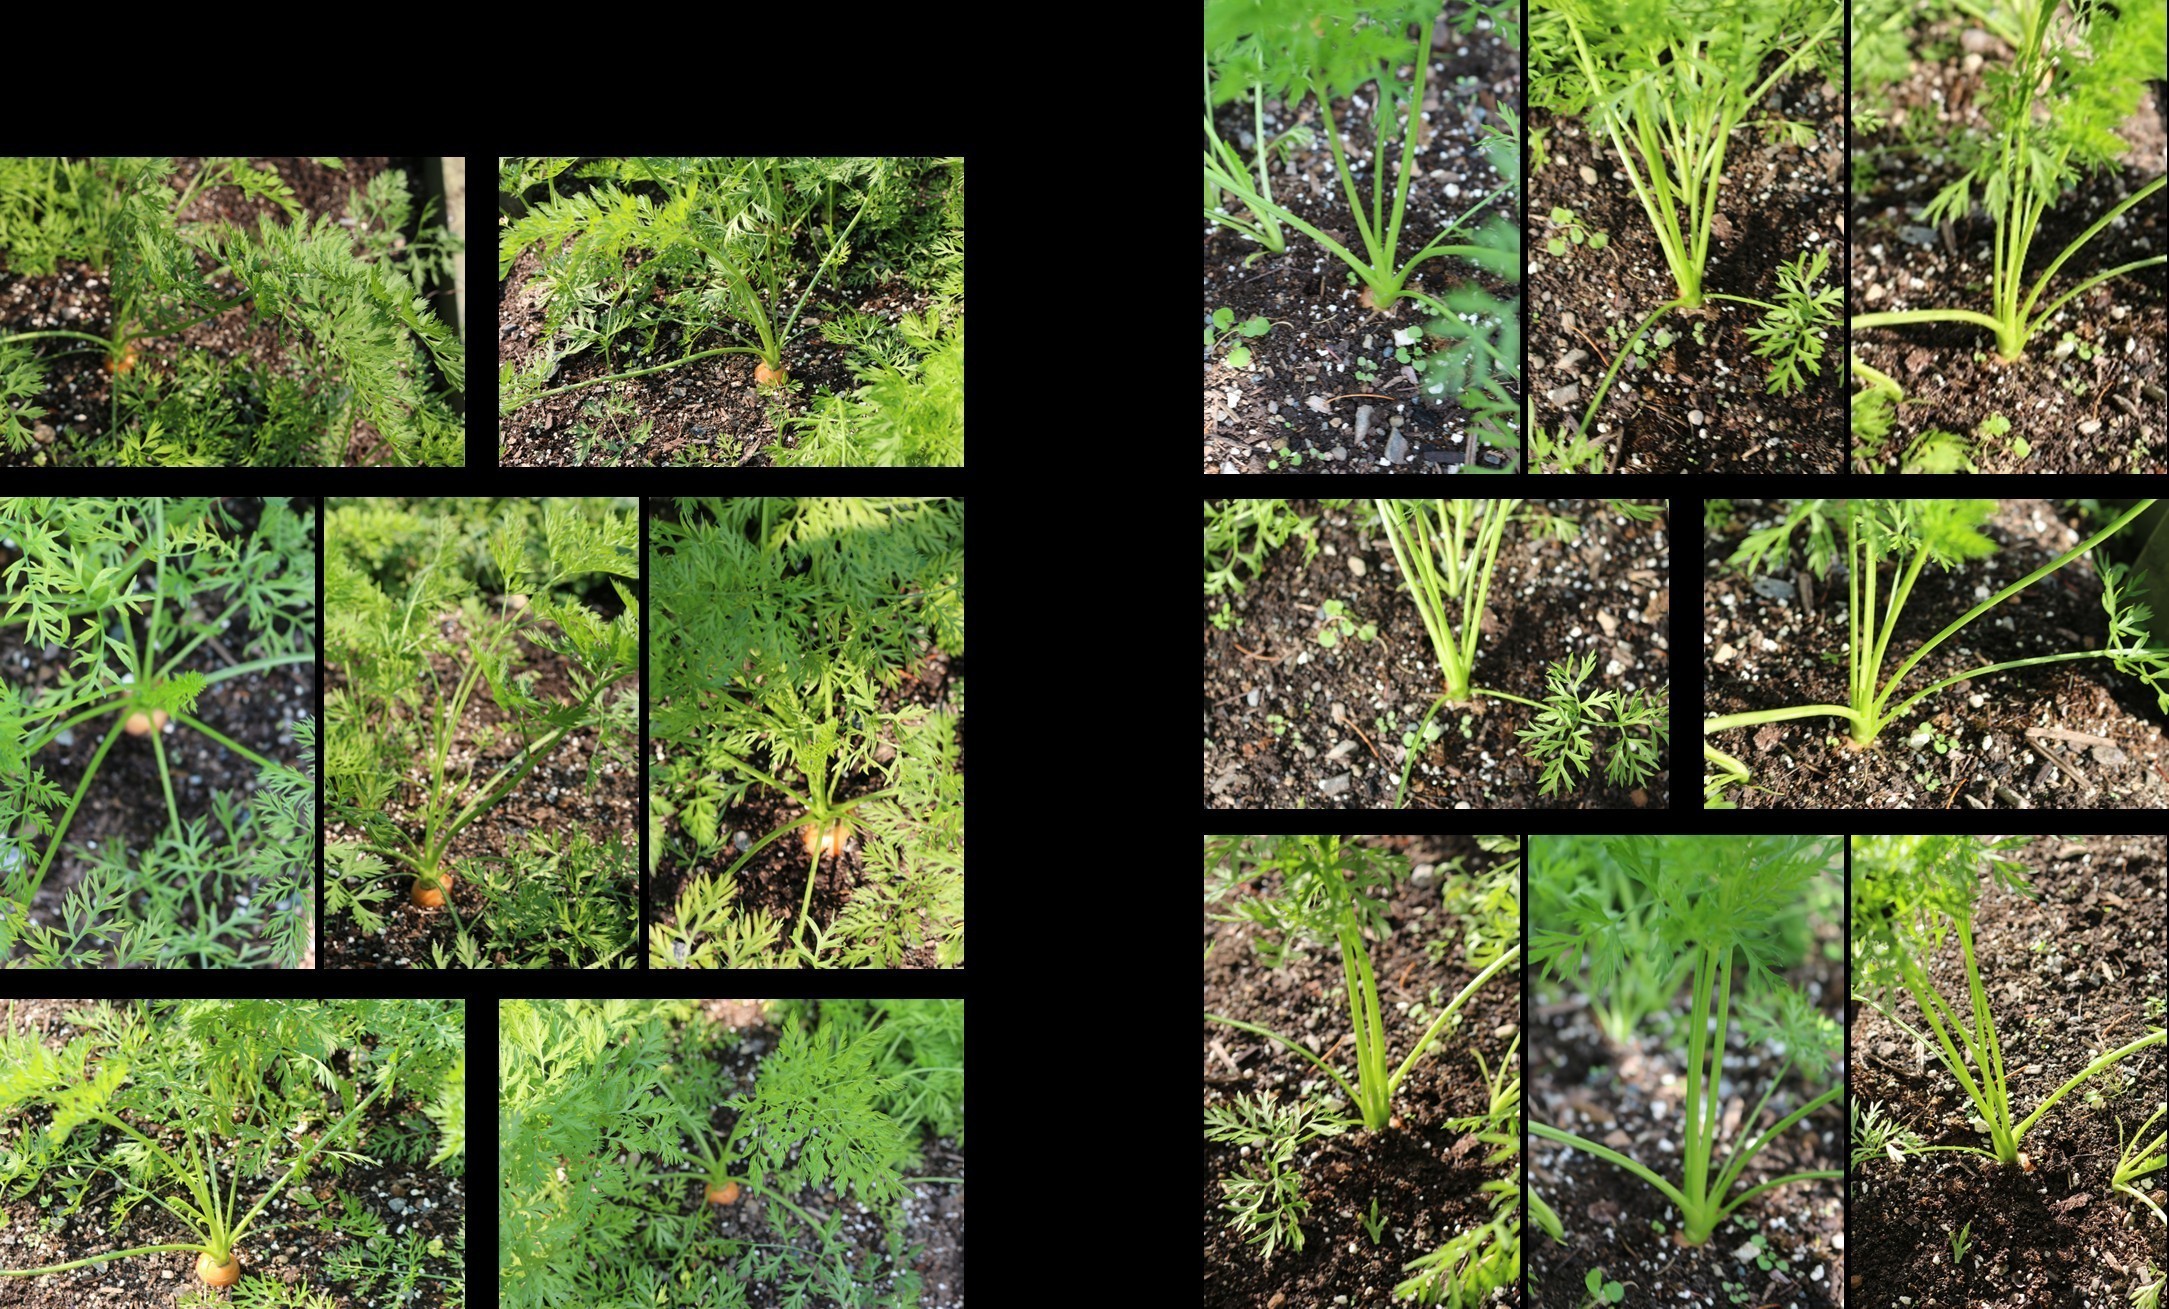
Figure 2: Example images of pre-harvest carrot plant. Images of carrot 65 (Left) and images of carrot 86 (Right).

Figure 3: Example image of post-harvest carrot next to a ruler used for measurement.
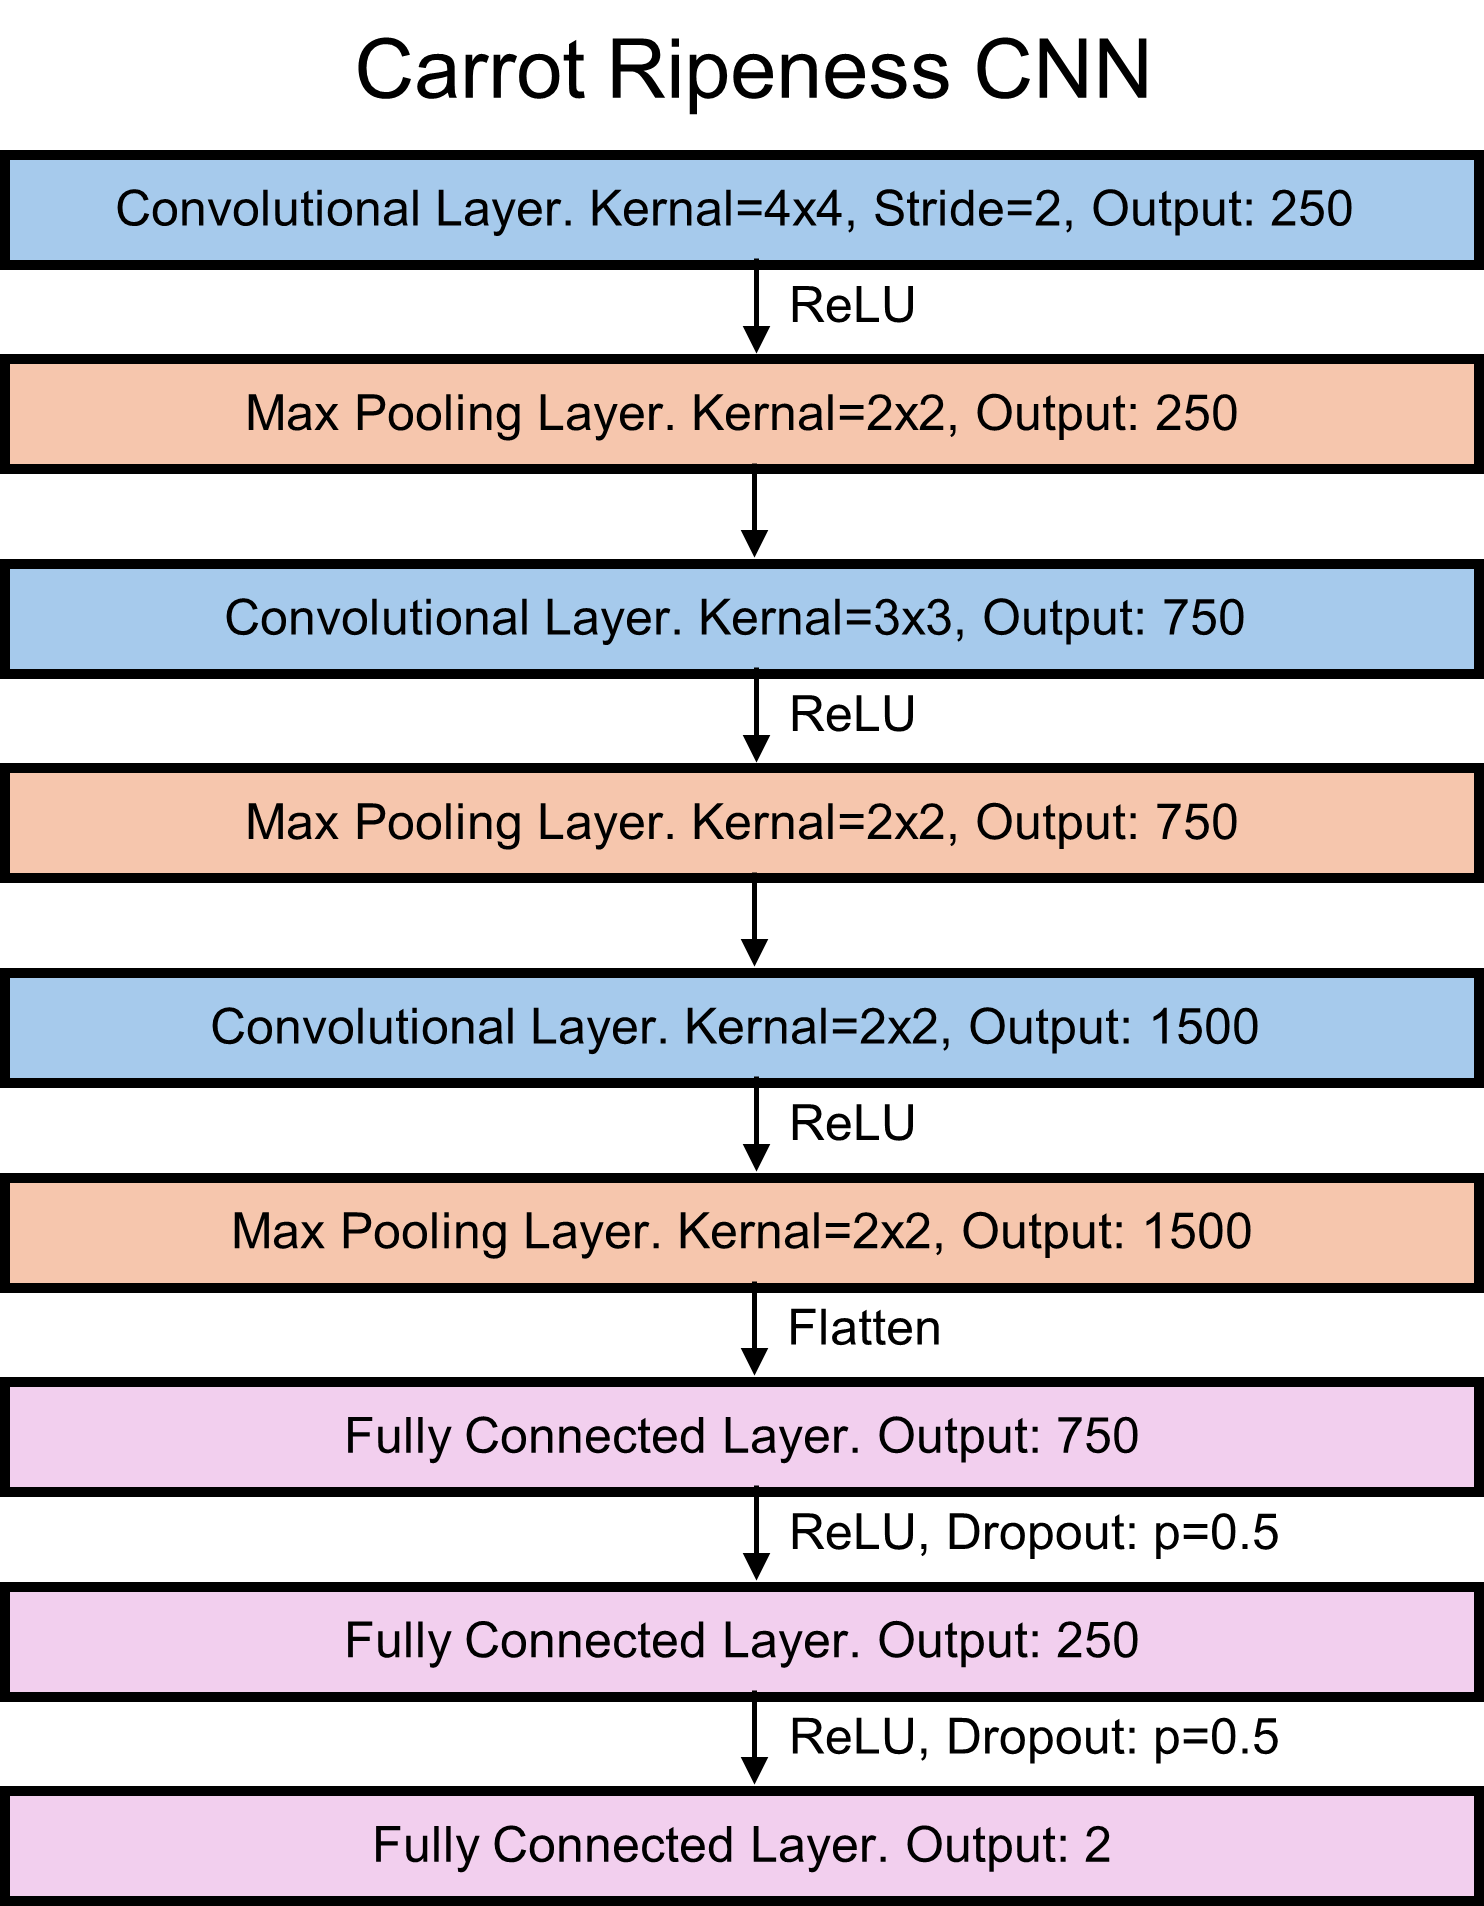
Figure 4: Flowchart of the CNN model.
References
Deng, L., Li, J., & Han, Z. (2021). Online defect detection and automatic grading of carrots using computer vision combined with deep learning methods. LWT, 149. https://doi.org/10.1016/j.lwt.2021.111832
Liong, S., Wu, Y., Liong, G., & Gan, Y.S. (2023). Moving towards agriculture 4.0: An AI-AOI carrot inspection system with accurate geometric properties. Journal of food engineering, 357. https://doi.org/10.1016/j.jfoodeng.2023.111632
Mukhiddinov, M., Muminov, A., & Cho, J. (2022).Improved Classification Approach for Fruits and Vegetables Freshness Based on Deep Learning. Sensors, 22(21), 8192. https://doi.org/10.3390/s22218192
Pietrangeli, R., & Cicatiello, C. (2024). Lost vegetables, lost value: Assessment of carrot downgrading and losses at a large producer organisation. Journal of Cleaner Production, 478. https://doi.org/10.1016/j.jclepro.2024.143873
Tapia-Mendez, E., Cruz-Albarran, I. A., Tovar-Arriaga, S., & Morales-Hernandez, L. A. (2023).Deep Learning-Based Method for Classification and Ripeness Assessment of Fruits and Vegetables. Applied Sciences, 13(22), 12504. https://doi.org/10.3390/app132212504
Zhao, Z., Hicks, Y., Sun, X., McGuinness, B. J., & Lim, H.S. (2025). A novel self-supervised method for in-field occluded apple ripeness determination. Computers and Electronics in Agriculture, 234. https://doi.org/10.1016/j.compag.2025.110246
West Coast Seeds (2025). One Seed at a Time: Gardening Guide 2025.