Asia Bajwa — Year 2, Life Science
Abstract
Light is an environmental factor influencing bacterial growth and stress responses. The effects of UV light are well-known while the effects of red-light remain poorly understood. This study investigated the impact of red-light exposure on the growth of Escherichia coli (E.coli) K-12 using colony-forming unit (CFU) counts. Bacterial cultures were serially diluted (10⁻⁵), plated on agar, and exposed to red LED light for 30, 60, and 90 minutes, while control samples were kept under standard lighting conditions. After incubation, colonies were stained with crystal violet and quantified using ImageJ software. CFU values were converted to log₁₀ CFU/mL to account for variation in bacterial counts. Mean CFU values for red-light-exposed samples were higher than controls at 30 and 60 minutes, but lower at 90 minutes; however, these differences were not statistically significant (p > 0.05). Overall, red-light exposure did not significantly affect E. coli growth, though variability suggests potential subtle effects requiring further investigation.
Introduction
Light is an important environmental factor that influences living organisms across all domains of life. In plants and animals, light regulates growth and development. In microorganisms such as bacteria, light can act as both an energy source and a source of stress depending on its wavelength and intensity (Lubart et al., 2011). Among the different types of light, ultraviolet (UV) radiation has been studied the most due to its strong ability to damage DNA and kill bacterial cells (Janion, 2008). In contrast, the effects of visible light, particularly longer wavelengths such as red light, are less understood (Vermeulen, 2006) because bacteria are frequently exposed to visible light in natural and human-made environments. Understanding how visible light affects bacterial stress responses and growth is an important area of research.
UV light is known to cause direct damage to bacterial DNA by forming lesions such as thymine dimers, which interfere with DNA replication and transcription (Janion, 2008). As a result, bacteria exposed to UV radiation often experience mutations, growth arrest, or cell death. Because of these harmful effects, UV light has been widely studied and is commonly used for sterilization and disinfection. However, UV light represents only a small portion of the light spectrum that bacteria encounter daily. Visible light, which includes wavelengths from approximately 400 to 700 nm, is far more common in natural settings such as soil, water, and indoor surfaces (Vermeulen, 2006), yet its biological effects on bacteria have received comparatively less attention.
To survive in an environment where DNA damage can occur, bacteria has evolved into highly regulated DNA repair systems. In Escherichia coli K-12, one of the most well-known DNA repair pathways is the SOS response, which is activated when DNA damage is detected and leads to the expression of genes involved in DNA repair and cell cycle regulation (Janion, 2008). Key proteins such as RecA and LexA coordinate this response, allowing cells to pause division and repair damage (Maslowska et al., 2019). If repair is unsuccessful, mutations or cell death may occur (Maslowska et al., 2019).
While the effects of UV light are well established, visible light can also influence bacterial stress through different mechanisms. Certain wavelengths, particularly blue and violet light, generate reactive oxygen species (ROS), which damage cellular components and cause oxidative stress (Lubart et al., 2011). Photobiomodulation research further suggests that light energy can interact with cellular processes, including DNA-related activity (Hamblin, 2016; Hamblin, 2024). Studies have shown that blue light can reduce bacterial populations through oxidative stress without added chemicals (Angarano et al., 2020), although most research focuses on these higher-energy wavelengths rather than longer wavelengths such as red light.
In contrast, red light occupies the longer-wavelength, lower-energy end of the visible light spectrum. It is often considered biologically mild and is commonly used in medical treatments such as phototherapy for wound healing and inflammation. However, emerging research suggests that red light can still influence bacterial cells under certain conditions. Studies have shown that low-level red laser exposure can induce measurable biological effects, including changes in bacterial survival and potential DNA damage depending on exposure intensity and duration (Karu, 1991). Other research suggests that red light may influence cellular processes linked to DNA repair and oxidative stress responses (de Freitas & Hamblin, 2016; Hamblin, 2024). Despite these findings, the exact biological effects of red light on bacterial growth remain unclear.
Another limitation in the current literature is the reliance on advanced molecular tools, such as fluorescent reporter genes and gene expression assays to study DNA repair activity. While these methods provide detailed information, they are not always accessible and may not reflect how bacteria behave under simpler laboratory conditions. Fewer studies examine bacterial responses using practical indicators such as colony formation and observable cell structure, which are directly related to bacterial growth.
Taken together, the existing research highlights several important gaps. First, while visible light has been shown to affect bacteria, most studies focus on high-energy wavelengths rather than red light. Second, much of the research emphasizes bacterial inactivation rather than changes in growth under controlled conditions. Third, there is limited investigation using accessible methods that measure bacterial growth directly. As a result, it remains unclear how red visible light influences bacterial growth.
This gap in knowledge is significant because bacteria are constantly exposed to visible light in everyday environments, including indoor spaces illuminated by LED lighting. Understanding how red light affects bacterial growth could improve the safe use of light-based technologies in medicine, biotechnology, and environmental control.
This project addresses this gap by examining how red-light exposure affects the growth of Escherichia coli K-12. By measuring colony-forming units (CFUs) and analyzing images using ImageJ software, this study focuses on whether bacterial growth changes under different light exposure conditions. This approach supports existing research while remaining accessible and relevant to real laboratory settings. The objective of this study was to determine whether exposure to red light affects the growth of Escherichia coli K-12, as measured by colony-forming unit (CFU) counts.
Materials and Methodology
Escherichia coli K-12colonies (Carolina Labs) were suspended in sterile 0.9% sodium chloride (NaCl) to prepare a 1.5 mL bacterial solution containing three colonies. Serial dilutions were then performed to obtain countable plates. Initial trials were used to troubleshoot dilution levels, as early plates showed overgrowth or insufficient colonies. A final dilution factor of approximately 10⁻⁵ (1:100,000) was selected. A volume of 60 µL of diluted suspension was plated onto 60 mm agar plates and spread evenly using sterile L-spreaders by rotating the plate.
A red LED plant light (Amazon) was positioned 10 cm above each individual plate using a 250 mL beaker and tape to stabilize the lamp (Figure 1). Aluminum foil barriers minimized ambient light (Figure 2). Control plates were left under white light, exposed under the same conditions (Figure 3). Exposure conditions were 30, 60 and 90 minutes for both the control and red light plates. Three replicates were prepared for each condition. All experimental conditions were kept consistent across trials to minimize variability.
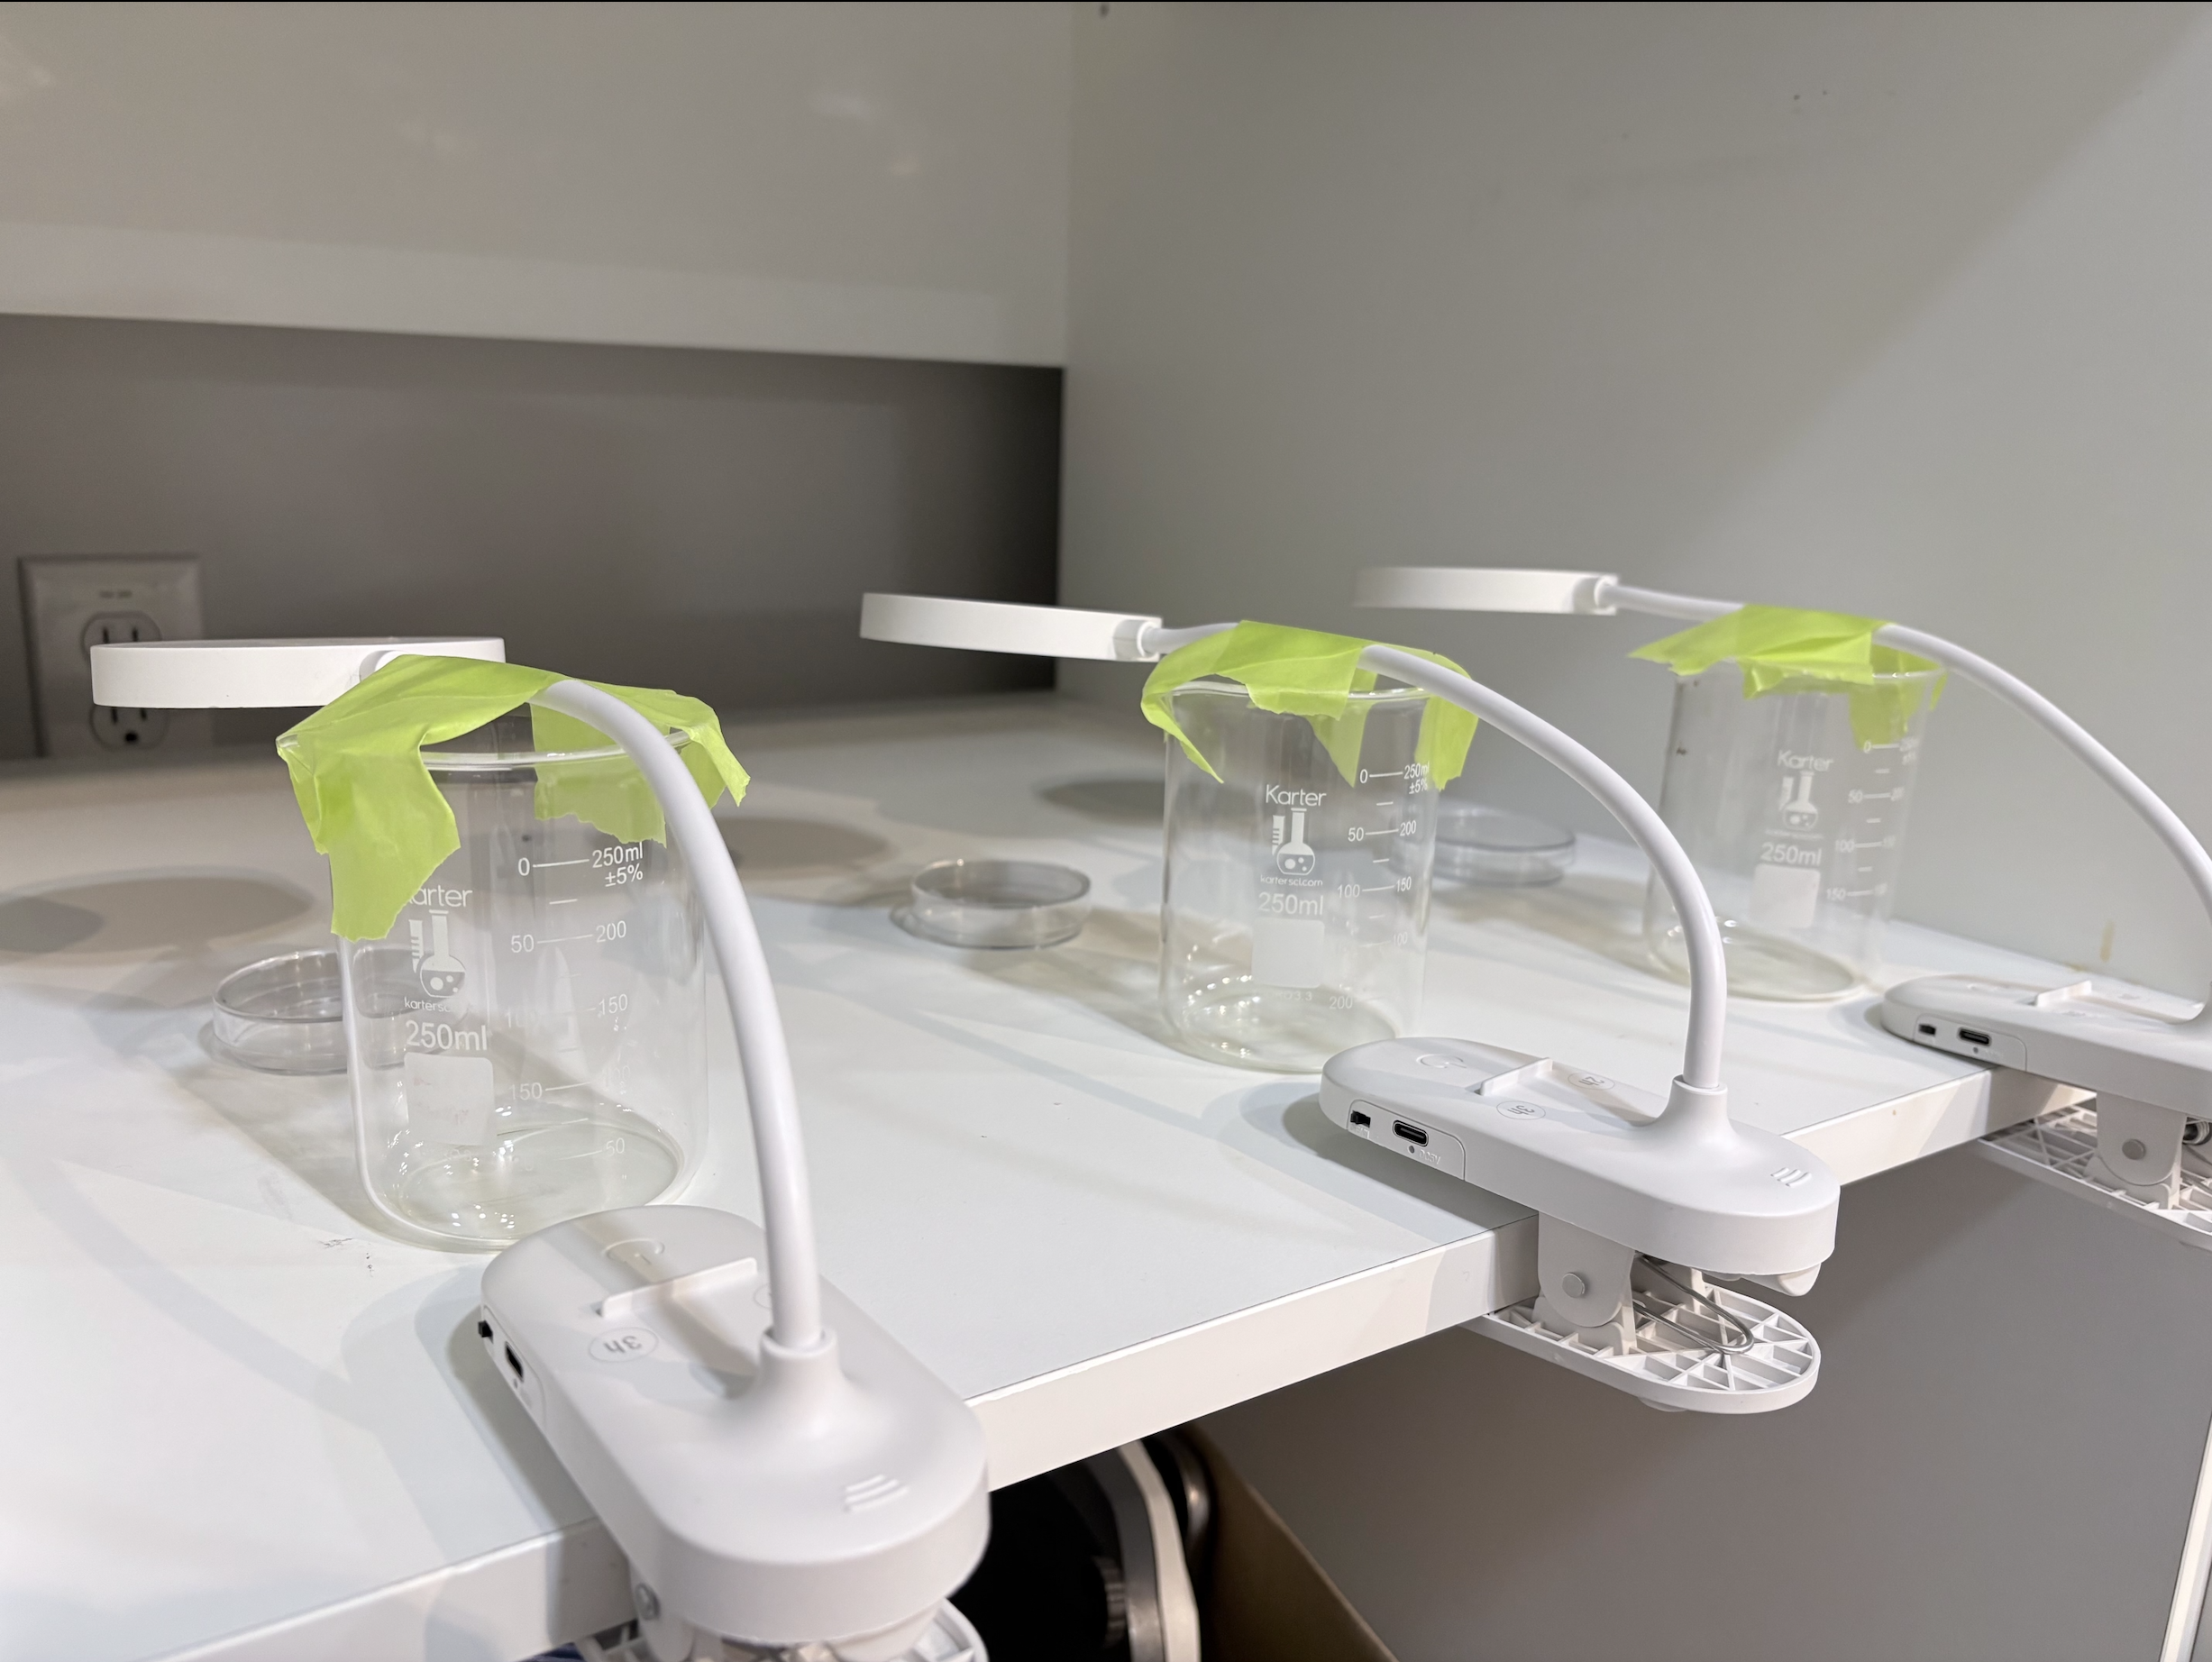
Figure 1: Red light experimental setup showing LED lamps positioned over E. coli culture plates, with aluminum foil barriers used to minimize ambient light exposure.
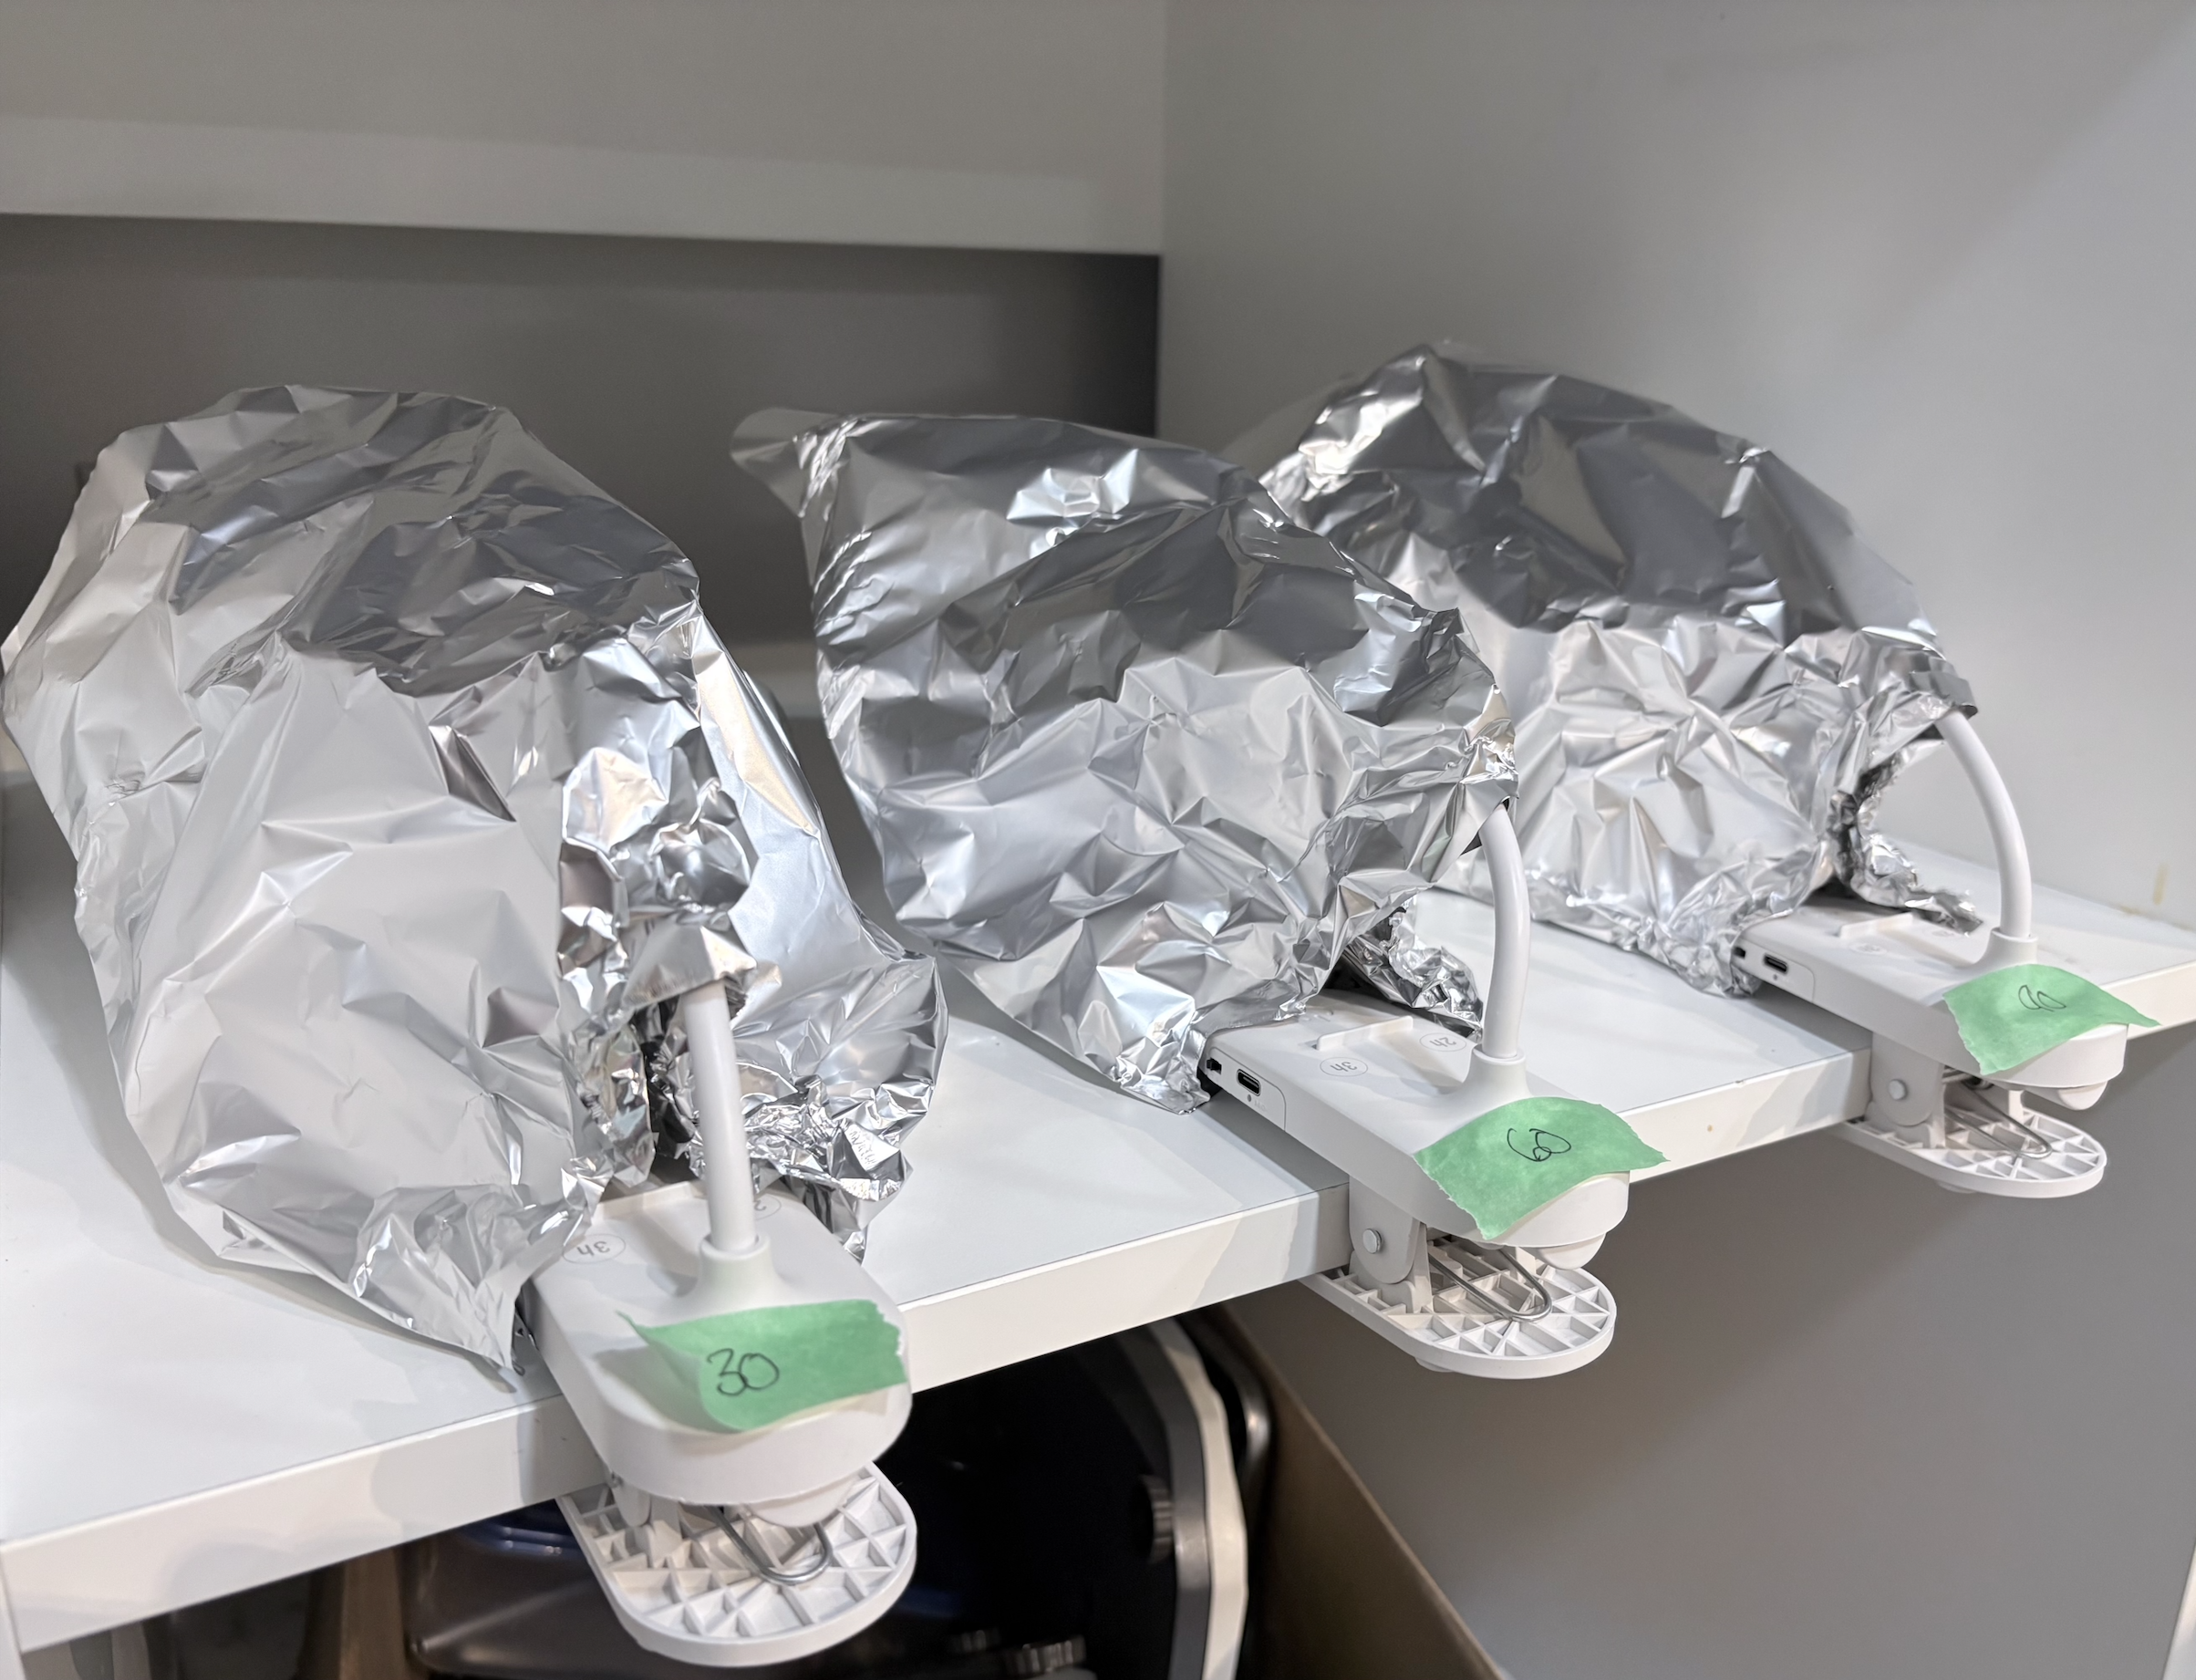
Figure 2: E coli agar plates being exposed to red light, displaying bacterial growth before incubation.
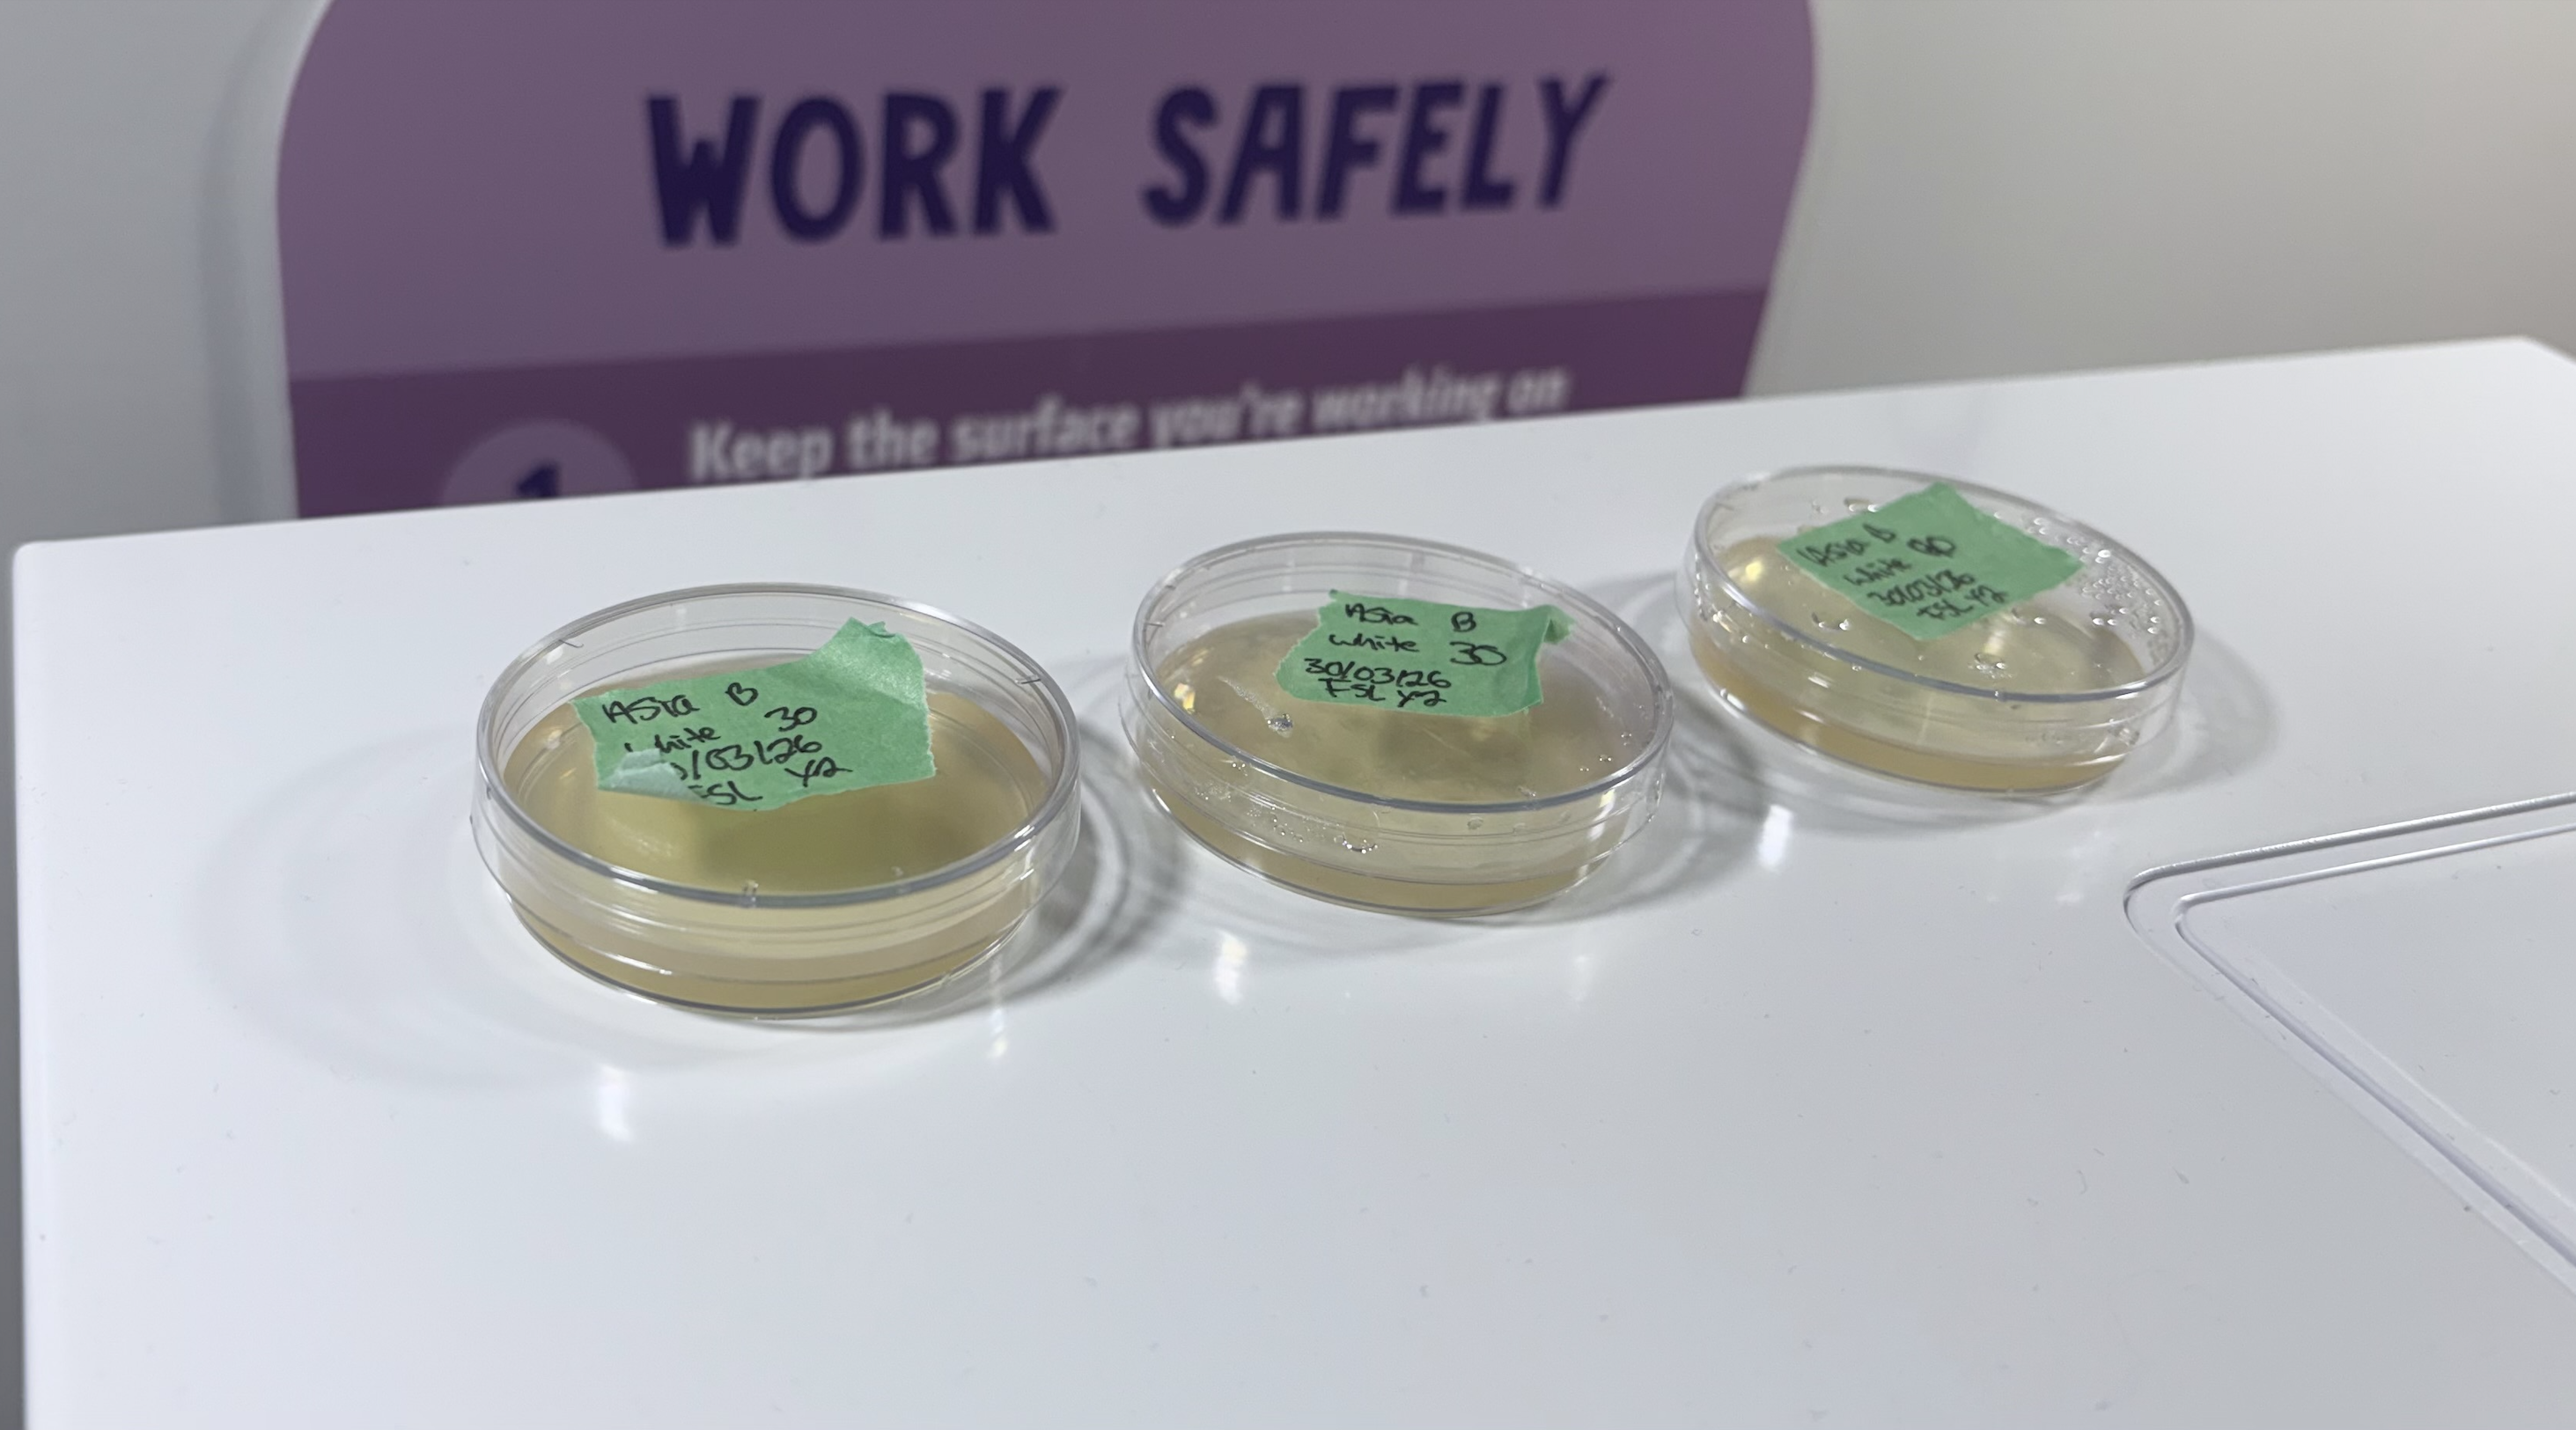
Figure 3: Control setup showing E. coli plates exposed to standard white light studio lighting without red light treatment.
Plates were then inverted and incubated for 24 hours at 37° C before being moved to the refrigerator to prevent further growth until analysis. A preliminary trial was conducted to validate the experimental design and methodology. The red-light setup maintained a consistent distance of 10 cm from the agar surface (Figures 1 & 2). After incubation, plates were stained with 1% crystal violet for 2 minutes, rinsed, and air-dried (Figures 10-12). Images were captured under consistent lighting conditions. Colony counts were determined using ImageJ software. Colony Forming Units (CFUs) were calculated using the formula: CFU/mL = (number of colonies x dilution factor) / volume plated (mL).Images were converted to grayscale, thresholded, and analyzed using particle analysis tools in ImageJ. A preliminary trial was conducted to validate dilution accuracy, light exposure consistency, and staining effectiveness.
Results
Quantitative data collection and analysis were completed for all three trials. CFU counts and corresponding log₁₀ CFU/mL values were recorded for both experimental (red-light) and control (white light) conditions across all time points (30, 60, and 90 minutes), as shown in Figures 4 and 5. Mean values were calculated from the three trials, and statistical comparisons between conditions were performed using a t-test (Figures 6-9).
CFU values were converted to a log₁₀ scale to account for the large range in bacterial counts and to improve data visualization. A CFU calculator was used to find the log₁₀ scale numbers. Bacterial populations can vary by several orders of magnitude, making raw values difficult to compare directly. Using a logarithmic scale allows for clearer comparison between conditions and helps highlight relative differences in growth across time points. The results of CFU analysis across all experimental conditions are presented below.
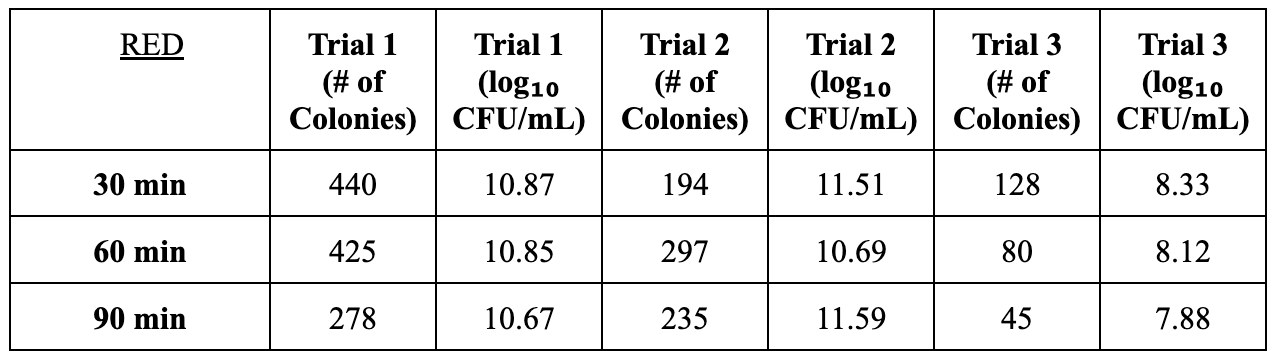
Figure 4: CFU counts and log₁₀ CFU/mL values for Escherichia coli K-12 after red-light exposure at 30, 60, and 90 minutes.
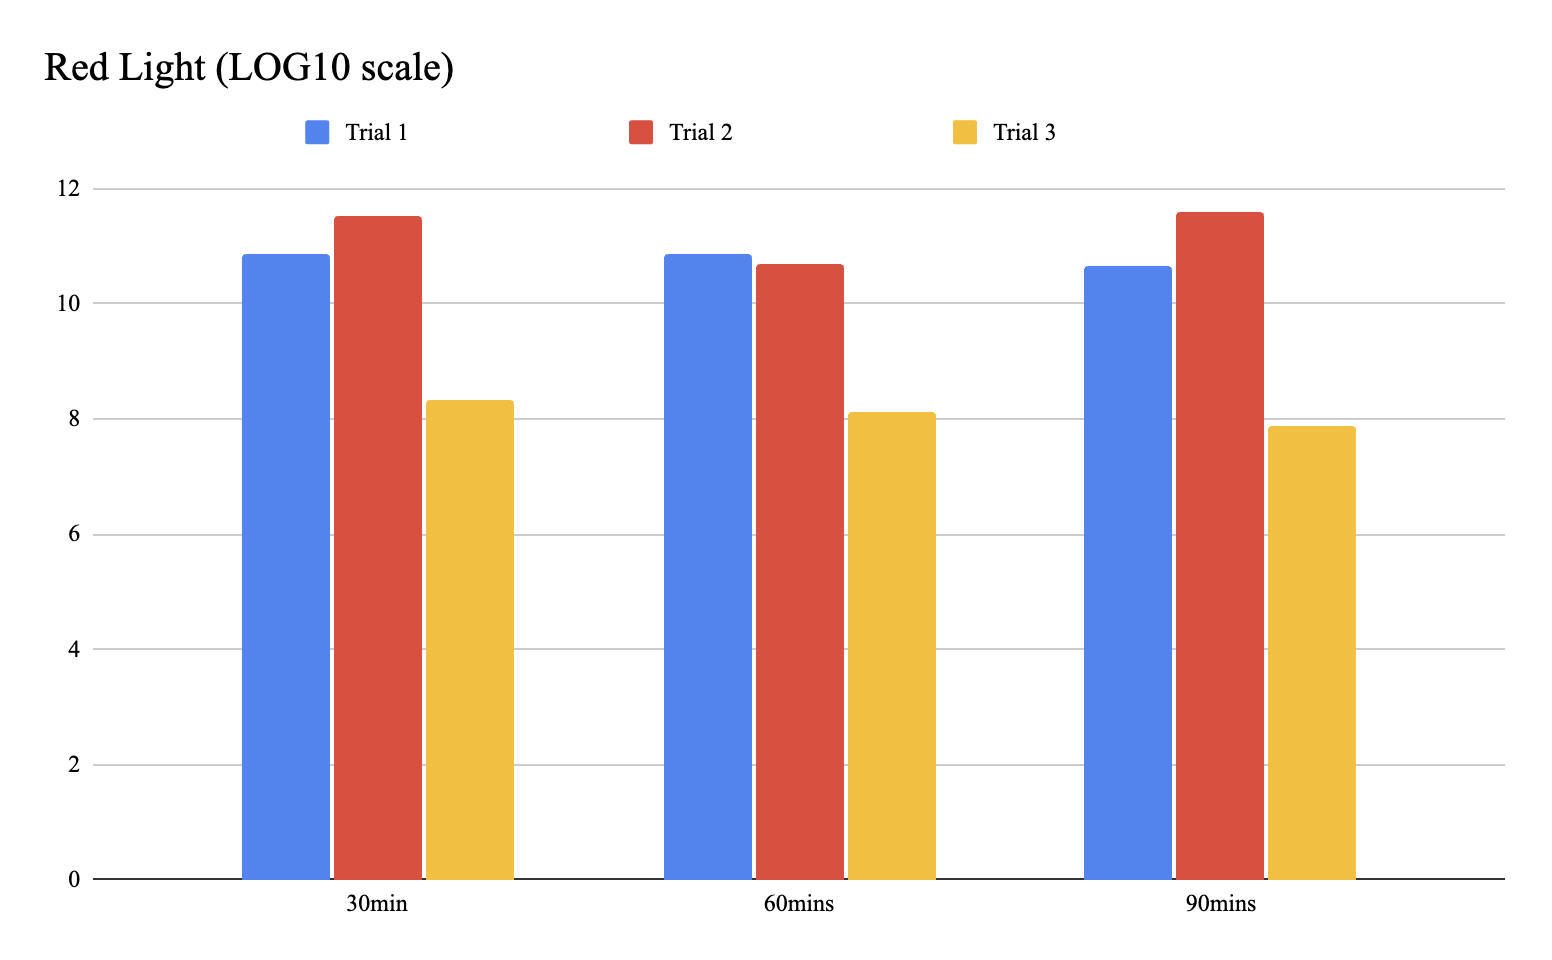
Figure 5: Average log₁₀ CFU/mL of Escherichia coli K-12 red-light exposure at 30, 60, and 90 minutes. Values represent the mean of experimental trials.
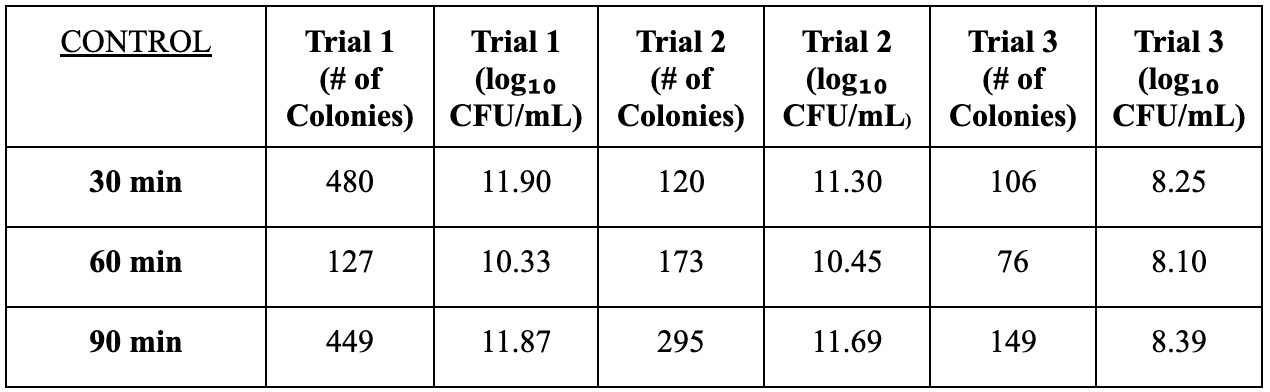
Figure 6: CFU counts and log₁₀ CFU/mL values for Escherichia coli K-12 under control white light conditions at 30, 60, and 90 minutes.
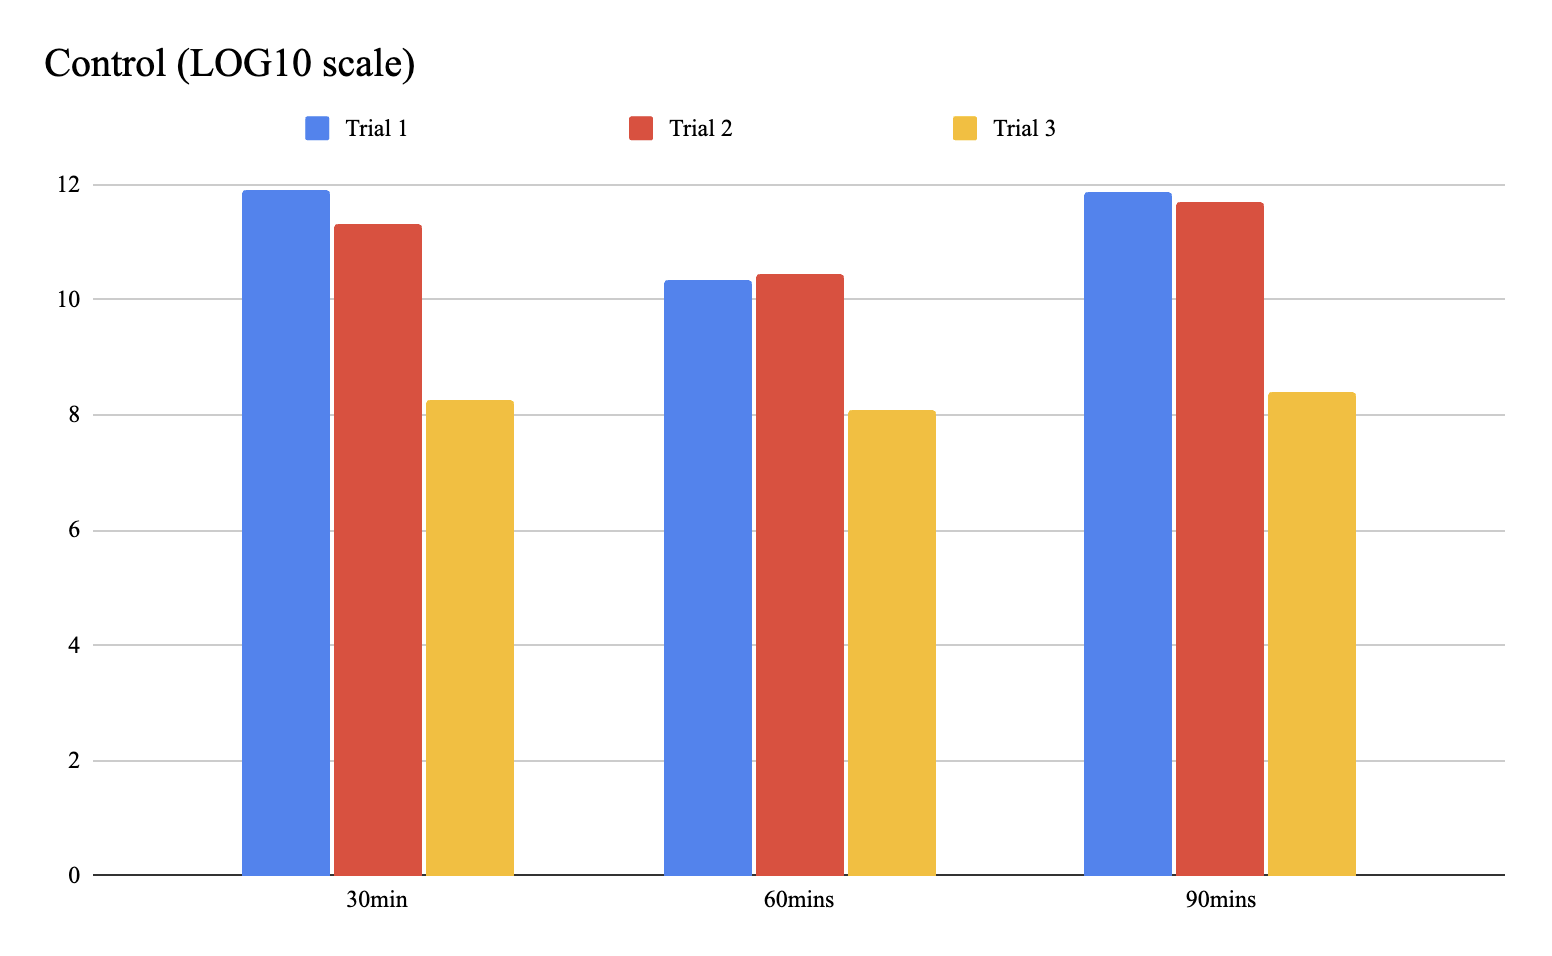
Figure 7: Average log₁₀ CFU/mL of Escherichia coli K-12 under control (white light) conditions at 30, 60, and 90 minutes. Values represent the mean of experimental trials.
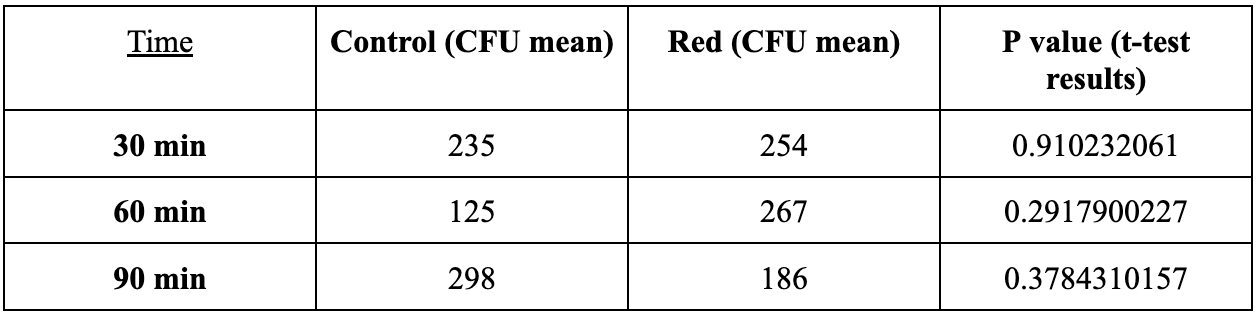
Figure 8: Planned comparison of mean CFU values between control and red-light conditions at each time point using a t-test (n = 3 per condition).
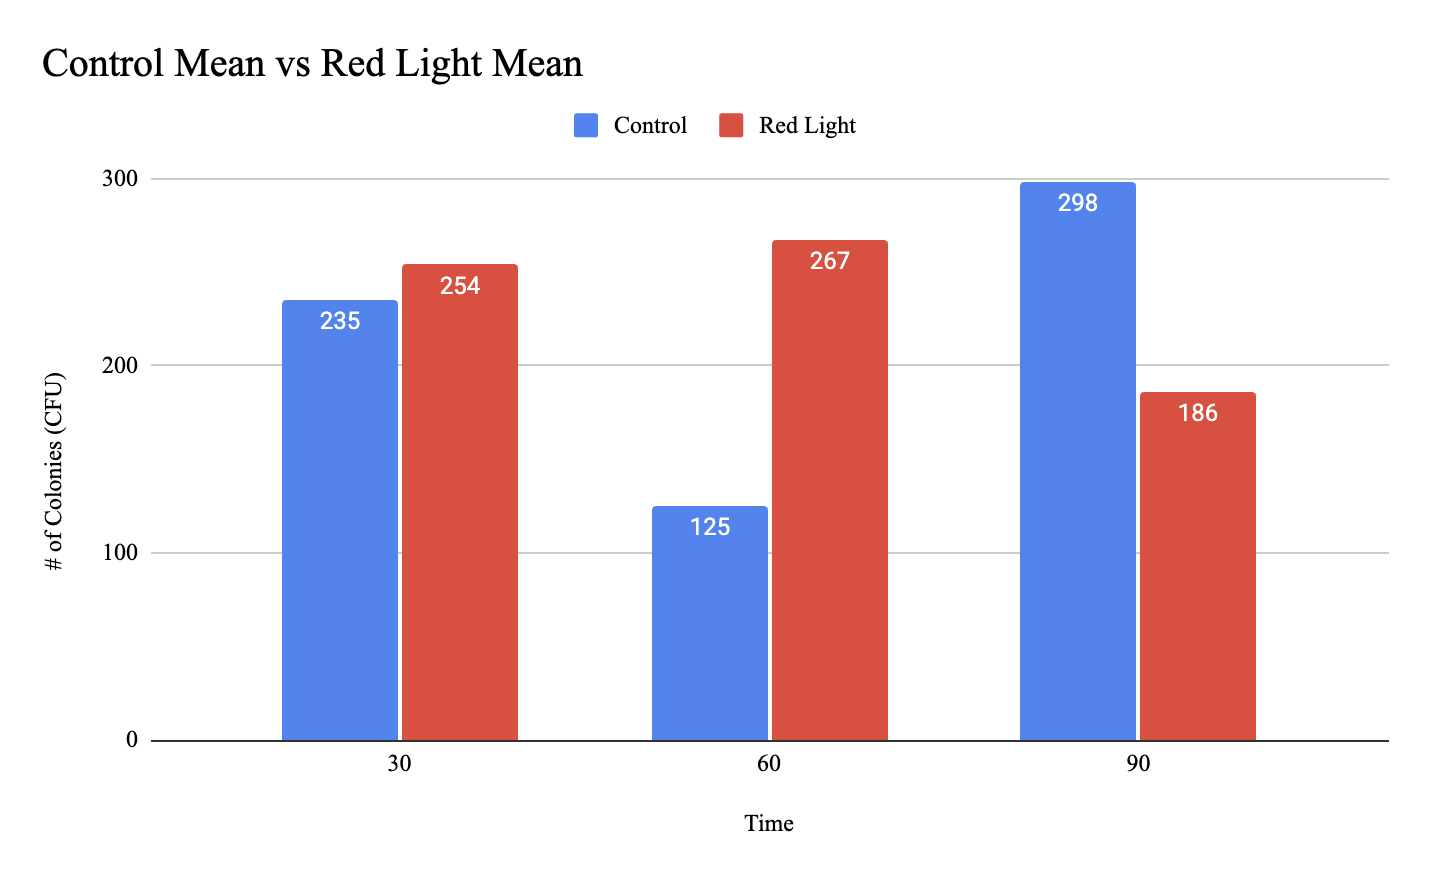
Figure 9: Statistical comparison of CFU counts between red-light exposure and control conditions at 30, 60, and 90 minutes using a t-test.
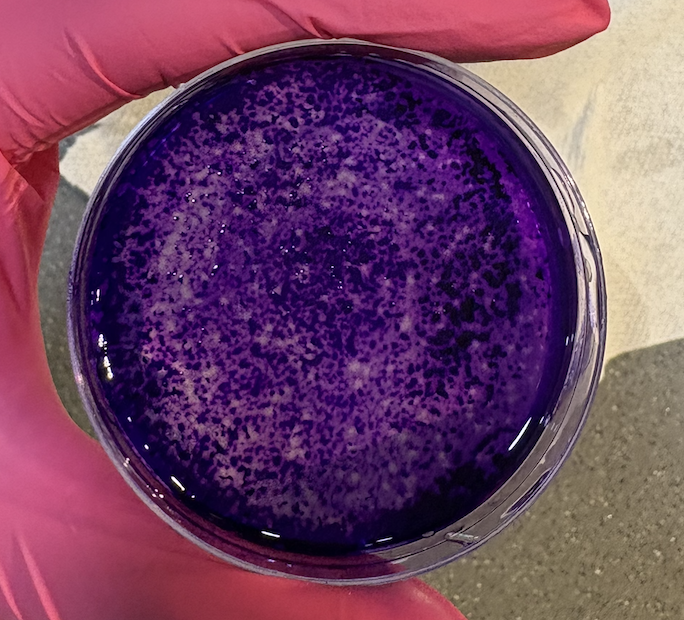
Figure 10: Escherichia coli K-12 plate from trial 1, (60 minute) exposure following application of crystal violet stain.
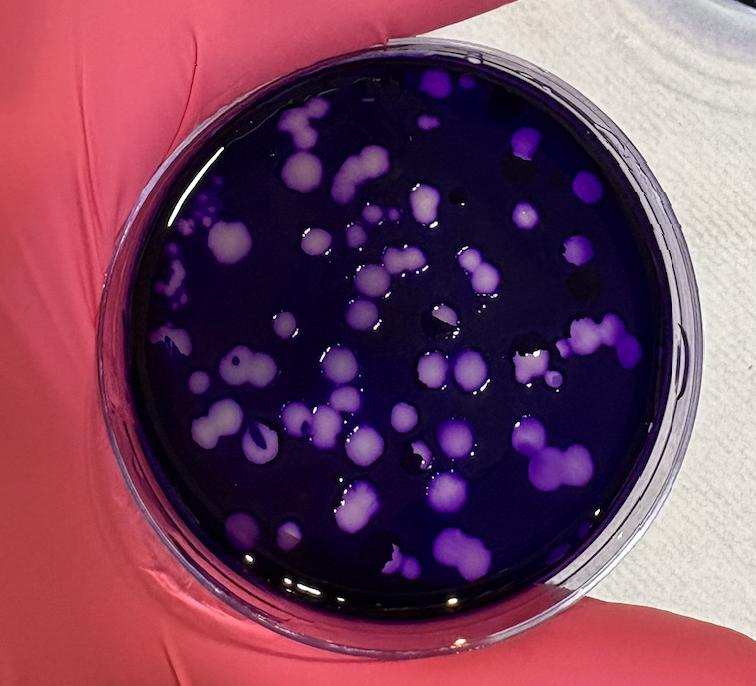
Figure 11: Escherichia coli K-12 plate from trial 2 (30 minute) exposure following application of crystal violet stain.
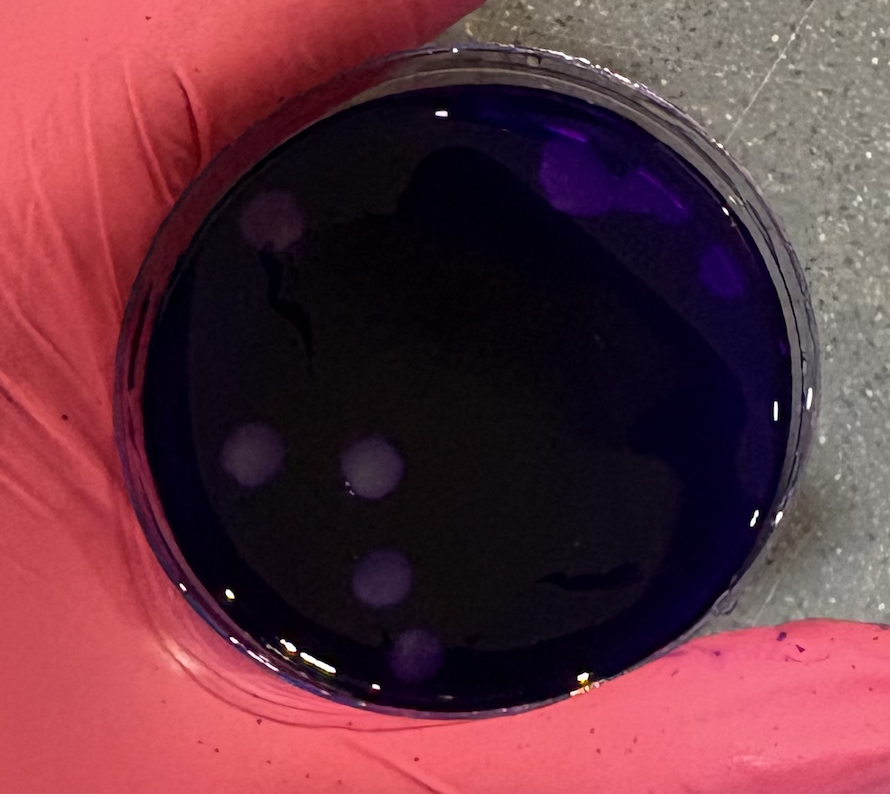
Figure 12: Escherichia coli K-12 plate from trial 3 (60 minute exposure following application of crystal violet stain.
Discussion
The results of this study demonstrate that the experimental design was effective in producing consistent and countable bacterial growth across all three trials. Serial dilution methods were successfully optimized, and plating techniques improved colony distribution across agar surfaces. The use of crystal violet staining enhanced colony visibility, allowing for accurate counting and supporting both manual analysis and future ImageJ-based quantification.
Across all three trials, red-light exposure showed variable effects on Escherichia coli K-12 growth. In trial 1, CFU counts decreased with increasing exposure time under red light, suggesting a potential inhibitory effect. However, trials 2 and 3 did not show a consistent trend, with CFU values fluctuating across time points. For example, trial 3 showed a sharp decrease in colony counts under red light at longer exposure times (from 128 colonies at 30 minutes to 45 colonies at 90 minutes), which may support the idea that prolonged exposure could reduce bacterial growth. In contrast, control conditions also showed variability, with CFU counts fluctuating rather than following a consistent pattern over time.
When comparing mean CFU values between red-light and control conditions, differences were observed at each time point. At 30 minutes, mean CFU values were similar between conditions (control: 235; red: 254), while at 60 minutes, red-light samples showed higher mean CFU counts than control samples. At 90 minutes, the trend reversed, with control samples showing higher mean CFU values than red-light samples. Despite these differences, t-test results indicated that none of the comparisons were statistically significant (p > 0.05 for all time points). This suggests that any observed differences in bacterial growth between red-light and control conditions may be due to natural variation rather than a direct effect of red-light exposure.
Several limitations may have contributed to the variability observed in the results. Minor light leakage through aluminum foil barriers may have unintentionally exposed control samples to light, potentially reducing the contrast between experimental and control conditions. Additionally, small inconsistencies in dilution accuracy, plating technique, or incubation conditions could have introduced variation between trials. Biological variability in bacterial growth and the relatively small sample size (n = 3 per condition) also limit the ability to detect subtle effects.
The use of log₁₀ CFU/mL values improved data interpretation by allowing comparisons across a wide range of bacterial counts. This transformation helped standardize the data and made trends easier to visualize, even when raw colony counts varied substantially between trials. However, log transformation may also reduce the visibility of absolute differences between conditions and can compress variability, potentially obscuring subtle but biologically relevant changes in bacterial growth.
Overall, the results suggest that red-light exposure does not have a statistically significant effect on E. coli growth under the conditions tested. However, some patterns, such as decreases in CFU counts at longer exposure times in certain trials can indicate that further investigation may be warranted. Future work should focus on increasing sample size, improving light isolation, and exploring additional variables such as light intensity or wavelength. These improvements may help clarify whether red light has subtle or condition-dependent effects on bacterial growth. This study contributes to a growing body of research examining how visible light interacts with microorganisms and may have implications for the use of light-based technologies in scientific and medical applications.
References
Angarano, V., Smet, C., Akkermans, S., Watt, C., Chieffi, A., & Van Impe, J. F. M. (2020). Visible light as an antimicrobial strategy for inactivation of Pseudomonas fluorescens and Staphylococcus epidermidis biofilms. Antibiotics, 9(4), 171. https://doi.org/10.3390/antibiotics9040171
BiteSize Bio. (n.d.). Quick and easy automatic cell counting. BiteSize Bio. https://bitesizebio.com/30184/quick-easy-automatic-cell-counting/
Bio-Rad Laboratories. (n.d.). Automated colony counting methods. YouTube. https://www.youtube.com/watch?v=GWLdxvgCCTY
de Freitas, L. F., & Hamblin, M. R. (2016). Proposed mechanisms of photobiomodulation or low-level light therapy. Lasers in Medical Science, 31(4), 661–672. https://doi.org/10.1007/s10103-016-1870-6
Hamblin, M. R. (2016). Mechanisms and applications of photobiomodulation. Journal of Biophotonics, 9(11–12), 1122–1135. https://doi.org/10.1002/jbio.201600218
Hamblin, M. R. (2024). Advances in photobiomodulation research. Lasers in Medical Science. https://doi.org/10.1007/s10103-024-04001-6
ImageJ. (n.d.). Using ImageJ for colony counting. YouTube. https://www.youtube.com/watch?v=UGGec7BX-KY
Janion, C. (2008). Inducible SOS response system of DNA repair and mutagenesis in Escherichia coli. International Journal of Biological Sciences, 4(6), 338–344. https://doi.org/10.7150/ijbs.4.338
Karu, T. I. (1991). Photobiological fundamentals of low-power laser therapy. IEEE Journal of Quantum Electronics, 27(10), 2517–2521. https://pubmed.ncbi.nlm.nih.gov/1855383/
Kearsey, M. (n.d.). Counting colonies protocol. University of Oxford. https://users.ox.ac.uk/~kearsey/resources/protocolsmirror/countingColonies.pdf
Khan Academy. (n.d.). Bacterial colony counting and CFUs. YouTube. https://www.youtube.com/watch?v=1PQprFZ2Byg
Learn Genetics. (n.d.). Serial dilution and plating technique. YouTube. https://www.youtube.com/watch?v=b0Q3Nge15XM
Lubart, R., Lipovski, A., Nitzan, Y., & Friedmann, H. (2011). A possible mechanism for the bacterial effect of visible light. Laser Therapy, 20(1), 17–22. https://doi.org/10.5978/islsm.20.17
Maslowska, K. H., Makiela-Dzbenska, K., & Fijalkowska, I. J. (2019). The SOS system: A complex and tightly regulated response to DNA damage. Environmental and Molecular Mutagenesis, 60(4), 368–384. https://doi.org/10.1002/em.22267
Stolze, N., Bader, C., Henning, C., Mastin, J., Holmes, A. E., & Sutlief, A. L. (2019). Automated image analysis with ImageJ of yeast colony forming units from cannabis flowers. Journal of Microbiological Methods, 164, 105681. https://doi.org/10.1016/j.mimet.2019.105681
University of Chicago. (2020). Cell counting: Automated and manual methods. https://cpb-us-w2.wpmucdn.com/voices.uchicago.edu/dist/c/2275/files/2020/01/cell_counting_automated_and_manual.pdf
Vermeulen, N. (2006). The effects of ultraviolet and visible light on bacterial survival (Master’s thesis, Lakehead University). https://knowledgecommons.lakeheadu.ca/bitstream/handle/2453/3358/VermeulenN2006m-1b.pdf
Virtue Project. (n.d.). Automated cell counting methods. https://www.virtue.gmbl.se/sites/default/files/english/2_indiv_automated.pdf