Kyle Tsui — Year 2, Applied Science
Abstract
Muon attenuation provides a powerful, non-invasive method for probing subsurface structures and material composition, with applications spanning geophysics and structural integrity assessment. This study evaluates the effectiveness of muon tomography as an alternative non-destructive evaluation (NDE) technique for geotechnical monitoring of coastal infrastructure exposed to high salinity environments. Traditional methods such as Ground Penetrating Radar (GPR) and seismic surveys often experience reduced performance in such terrain due to electromagnetic attenuation, and moisture variability. To address these limitations, this work investigates the use of cosmic-ray muons—highly penetrative subatomic particles—to infer internal density variations within materials. A proof-of-concept model was constructed using the Cosmic Watch portable muon detector and was tested on media commonly found in this aforementioned terrain.
Introduction
Seawalls are among the most influential and critical pieces of modern infrastructure. They allow urban development in one of the most rapidly changing terrains by absorbing the impact of storms, dynamic sea levels, and erosion (Deng et al., 2026). However, as climates around coastal cities continue to intensify in lieu of climate change and rising sea levels, the reliability of sea walls become a cornerstone for ensuring the persistence of many coastal cities. The degradation of said infrastructure – such as voids forming due to dynamic backfill, cracks propagating through large pieces of concrete, or the corrosion of reinforcement and rebar – is often insidious and not directly visible (Deng et al., 2026). Consequently, intensive and recurrent geotechnical surveys have been used ensure their stability. Traditional methods can be expensive, time consuming, and limited in coverage, and while there exists certain non-destructive evaluation methods (NDEs), such as Ground Penetrating Radar (GPR) or seismic surveys, they often struggle in coastal conditions due to high saline concentrations, moisture variability, and heterogeneous backfill stratigraphy (Doolittle et al., 2007). These factors increase electric attenuation and subsequently reducing the range and effectiveness of these methods (Doolittle et al., 2007). Nevertheless, in recent years a new field of research has come into fruition, known as muon tomography. By exploiting the characters of subatomic particles known as muons, geoscientists have been able to survey locations that are otherwise difficult to accurately analyze. By assessing the muon flux, the number of muons detected passing through a given area, it can be inferred whether a low density void exists on a given path by comparing relative muon counts between regular and anomalous terrain. Its ability to permeate nearly every object gives it an edge for imaging dense materials or survey points located deep underground (International Atomic Energy Agency, 2023; Lechmann et al., 2021; Lesparre et al., 2010), and its imperviousness towards challenges associated with coastal geotechnical surveys makes muon tomography an excellent NDE alternative. Aiming to provide an alternative for traditional NDEs, this paper tests a constructed proof-of-concept model to appraise its ability to detect density anomalies often associated with weak segments of seawall. By linking muon-based density reconstructions to structural degradation signatures and decision-relevant inspection objectives, this work aims to clarify the conditions under which muon tomography provides actionable diagnostic value for seawall condition evaluation and maintenance planning.
Related Work
There exists a broad range of research on muon tomography, informally known as muography. Most notably it has proven to be highly effective in underground laboratories, to understand geological cover, and volcanoes, to pinpoint possible hazards. In the former, the muon telescope was placed in the Mont-Terri laboratory, Switzerland, located 300 meters below the surface. The sediment above this laboratory consisted primarily of clay and limestone, with respective depths varying from 200 to 500 meters. The telescope was placed in a few locations, and by comparing the observed muon flux with the expected muon flux, calculated from the densities of clay and limestone, 2.4 and 2.7 respectively, the lithologic boundary of clay to limestone was determined (Lechmann et al., 2021). In the latter application, muon telescopes were placed near the base of the volcano to image the internal structure. It allowed scientists to identify cavities located in the volcanic dome, which is crucial to build accurate flank destabilization models (Lesparre et al., 2010). Alternatively, more novel uses of muon tomography include its applications in analyzing sediment buildup above underwater tunnels, a proof of concept conducted by a Shanghai group of researchers (Khaw et al., 2025). In the paper, the muon telescope was tested at the Shanghai Outer Ring Tunnel, located under the Hangpu River and spanning approximately 2880 meters. The team first simulated the expected attenuation rates with the limited topographical knowledge of the sediment located above this tunnel. Using Geant4 (Agostinelli et al., 2003) they established a baseline before using a muon telescope to log the experimental attenuation. The muon telescope used consisted of two HDN-S2 Plastic Scintillators, each spanner 80x20x2 cm3. Notice that this is significantly larger than our proposed scintillator sizes (each only 5x5x1 cm3) and therefore we should expect far longer data logging times than the Shanghai team (1.5 days) (Khaw et al., 2025). The team observed a strong negative correlation with tide levels, as expected, and returned a very close measurement to the real expected values (Simulated by Geant4) (Agostinelli et al., 2003; Khaw et al., 2025). However, there exists many limitations of muon tomography discovered from past research, most notably the inherent fluctuations. Over different times or locations, the baseline flux of an open-sky measurement varies significantly, due to a number of factors including but not limited to: altitude, global position (longitude and latitude), barometric pressure, humidity in respective order of significance (Jourde et al., 2013; Su et al., 2021). This prevents muon tomography from creating high resolution reconstructions and instead limits it to very coarse imaging.
Muon Properties
Muons are what are known as secondary cosmic rays. They originate in the upper atmosphere and are created by collisions with upper atmosphere nuclei (Bonechi et al., 2019). These collisions, caused by primary cosmic rays, form pions and kaons which eventually decay into the muon shown in the following reaction equation using nitrogen as an example:
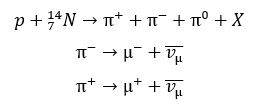
Being the elementary particle of interest, the muon (μ⁻) is a second generation lepton that possesses a mass of roughly 105.66 MeV/c² (about 207 times heavier than an electron) (Bonechi et al., 2019) travelling at a velocity bordering the magnitude of light (0.98-0.99c), giving it a scintillation detection signature of typically ~2 MeV per cm of plastic (Bonechi et al., 2019) and an electrical pulse a few nano-seconds wide.
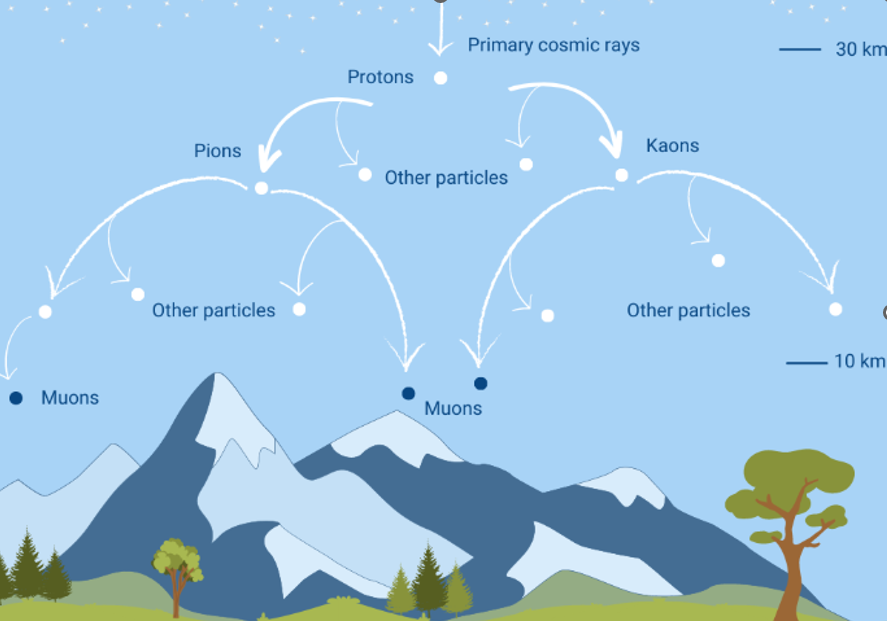
Figure 1.1: Image showing the process of the creation of muons in the upper atmosphere
Muon Detection
Currently there exists two primary approaches in muon detection: attenuation-based muon tomography and scatter muon tomography. The former leverages differences in muon flux based on the path it had to travel to reach the detector. For paths with a higher average density, the attenuation rate of the muon flux is higher (fewer muons are observed) and vice versa (Lechmann et al., 2021; Lesparre et al., 2010). In other words, the muon flux is negatively correlated with the average density of the path. The second method, scatter-based muon tomography, is primarily used for high atomic mass testing. By analyzing the way muons scatter, it can be determined whether high atomic mass elements such as uranium exist in the sample (Bonechi et al., 2019). The applications of this method are mostly limited to cargo screening for dangerous materials. In the case of geotechnical surveys, attenuation-based muon tomography is more effective as it is primarily based around low density materials. In attenuation-based muon tomography, data is usually collected using a design known as a muon telescope. A muon telescope consists of 3 individual scintillator matrices, each connected to a silicon photomultiplier (SiPM). A scintillator matrix is often constructed from a grid of individual scintillators, connected to a single master clock (Lechmann et al., 2021). By assessing whether all 3 layers of the muon telescope trigger, researchers are able to mitigate background noise and false positives, and by assessing which individual scintillators activate, the direction of the muons can be determined. In order to detect these subatomic particles researchers utilize three separate components: a scintillator, a photomultiplier, and the Arduino. The muon first comes into contact with the scintillator, which through the process of ionization, converts the energy released from the particle collision into photons, visible light. This light then passes through the photomultiplier tube or silicon photomultiplier, depending on the design used. This is finally fed through a circuit which lengthens this pulse to a signal long enough to be detected by an Arduino (Axani et al., 2018).
Methodology
In order to accurately determine muon attenuation, three pieces of data were measured: timestamp, the time at which a particle is detected (UTC); quantity, the number of muons detected within a certain time frame; and deadtime, the period which the detector is rendered null by a previous detection. Using the aforementioned data points This experiment will be divided into control and test trails. For control trials the detector will be exposed to an open-sky measurement to define a baseline flux — approximately 1800 per hour (0.5hz) for a 5×5 cm scintillator (Axani et al., 2018), although this value may change depending on the barometric pressure, temperature, humidity and other environ-mental factors (Jourde et al., 2013; Su et al., 2021). This “baseline flux” will be denoted as Rreference which was used to calculate expected attenuation without shielding from the tested media. For the test trails, the single detector was placed under varying mediums (as seen by fig 3), including sand, water, and other matter commonly found underground, establishing a sample flux, denoted as Rtarget.
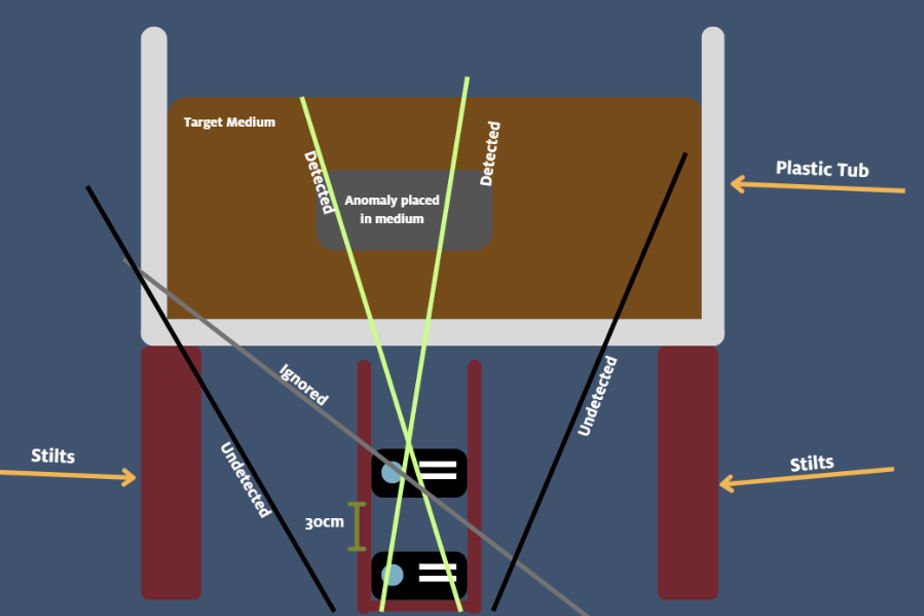
Figure 4.1: Image depicting the setup of the detector under a sample medium (Configured in telescope).
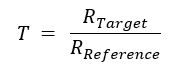
For higher density mediums a lower quantity of muons was expected and vice versa. In other words, a negative correlation between muon quantity and path density (Lechmann et al., 2021; Lesparre et al., 2010) was used to determine density. Hence, using the baseline and sample flux the attenuation rate, denoted by T (Lesparre et al., 2010), can be calculated as such where:
A total of 8 conditions were tested with a combined sum of 20 trials over the course of about 1 months’ time:
- Baseline flux on land (3 Trials on different days, 12 hours each)
- Baseline flux near the ocean (1 Trial, 4 hours)
- Flux under 20 cm and 40cm of sand and wet sand over the course of 1 day (12 Trials 3 per test condition, 4 hours each)
- Single channel vs. telescope for baseline flux at open-sky measurement (3 Trials, 12 hours each)
- Single channel vs. telescope for ocean-side flux (1 Trial, 4 hours)
The seawall measurements, due to the shorter trial times as it required constant monitoring, was accompanied by ancillary simulation using Geant4 (Agostinelli et al., 2003). However, it is worth noting that this design contains a few critical flaws. The primary area of concern is the absence of coincidence rejection. Without two detectors, it is difficult to differentiate between short-lived electromagnetic magnetic background and true muons thus weakening its sensitivity to flux changes. This boils down to the fact that a true muon will trigger both sensors within quick succession of one another, while background noise will likely only trigger one, allowing the exclusion of signals where only one detector was triggered (Axani et al., 2018; Lechmann et al., 2021). Another point of concern would be its angular acceptance (Cecchini & Spurio, 2012). Since muons come from all angles, even a dense object overhead only slightly reduces the total count. This difference would be difficult to distinguish from normal environmental fluctuations such as pressure or temperature. Fortunately, this issue can be mostly mitigated by longer exposure times and better experiment design such that the targeted medium covers a wider range of the detector.
Results And Discussion
Particle Noise & Baseline
The first goal was to analyze the impact of particle noise, detections that are not muons. To do this, data was collected over a 12-hour period for the land-based open-sky measurement and over a 4-hour period for the ocean-side open-sky measurement. Since ocean-side required constant supervision the testing periods lasted a shorter time than the land-based measurements.
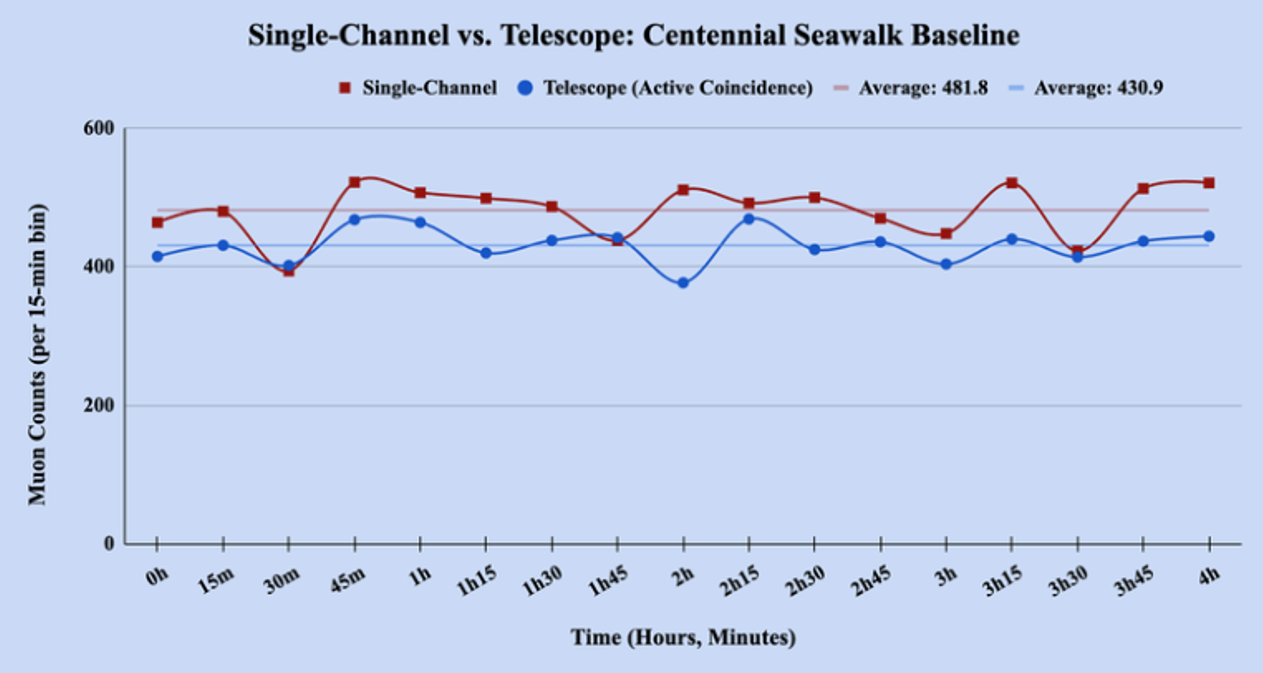
Figure 5.1: Telescope compared to single channel detection observed at the Centennial Seawalk, West Vancouver. The data was collected over a 4 hour period on the same day with mostly clear skies.
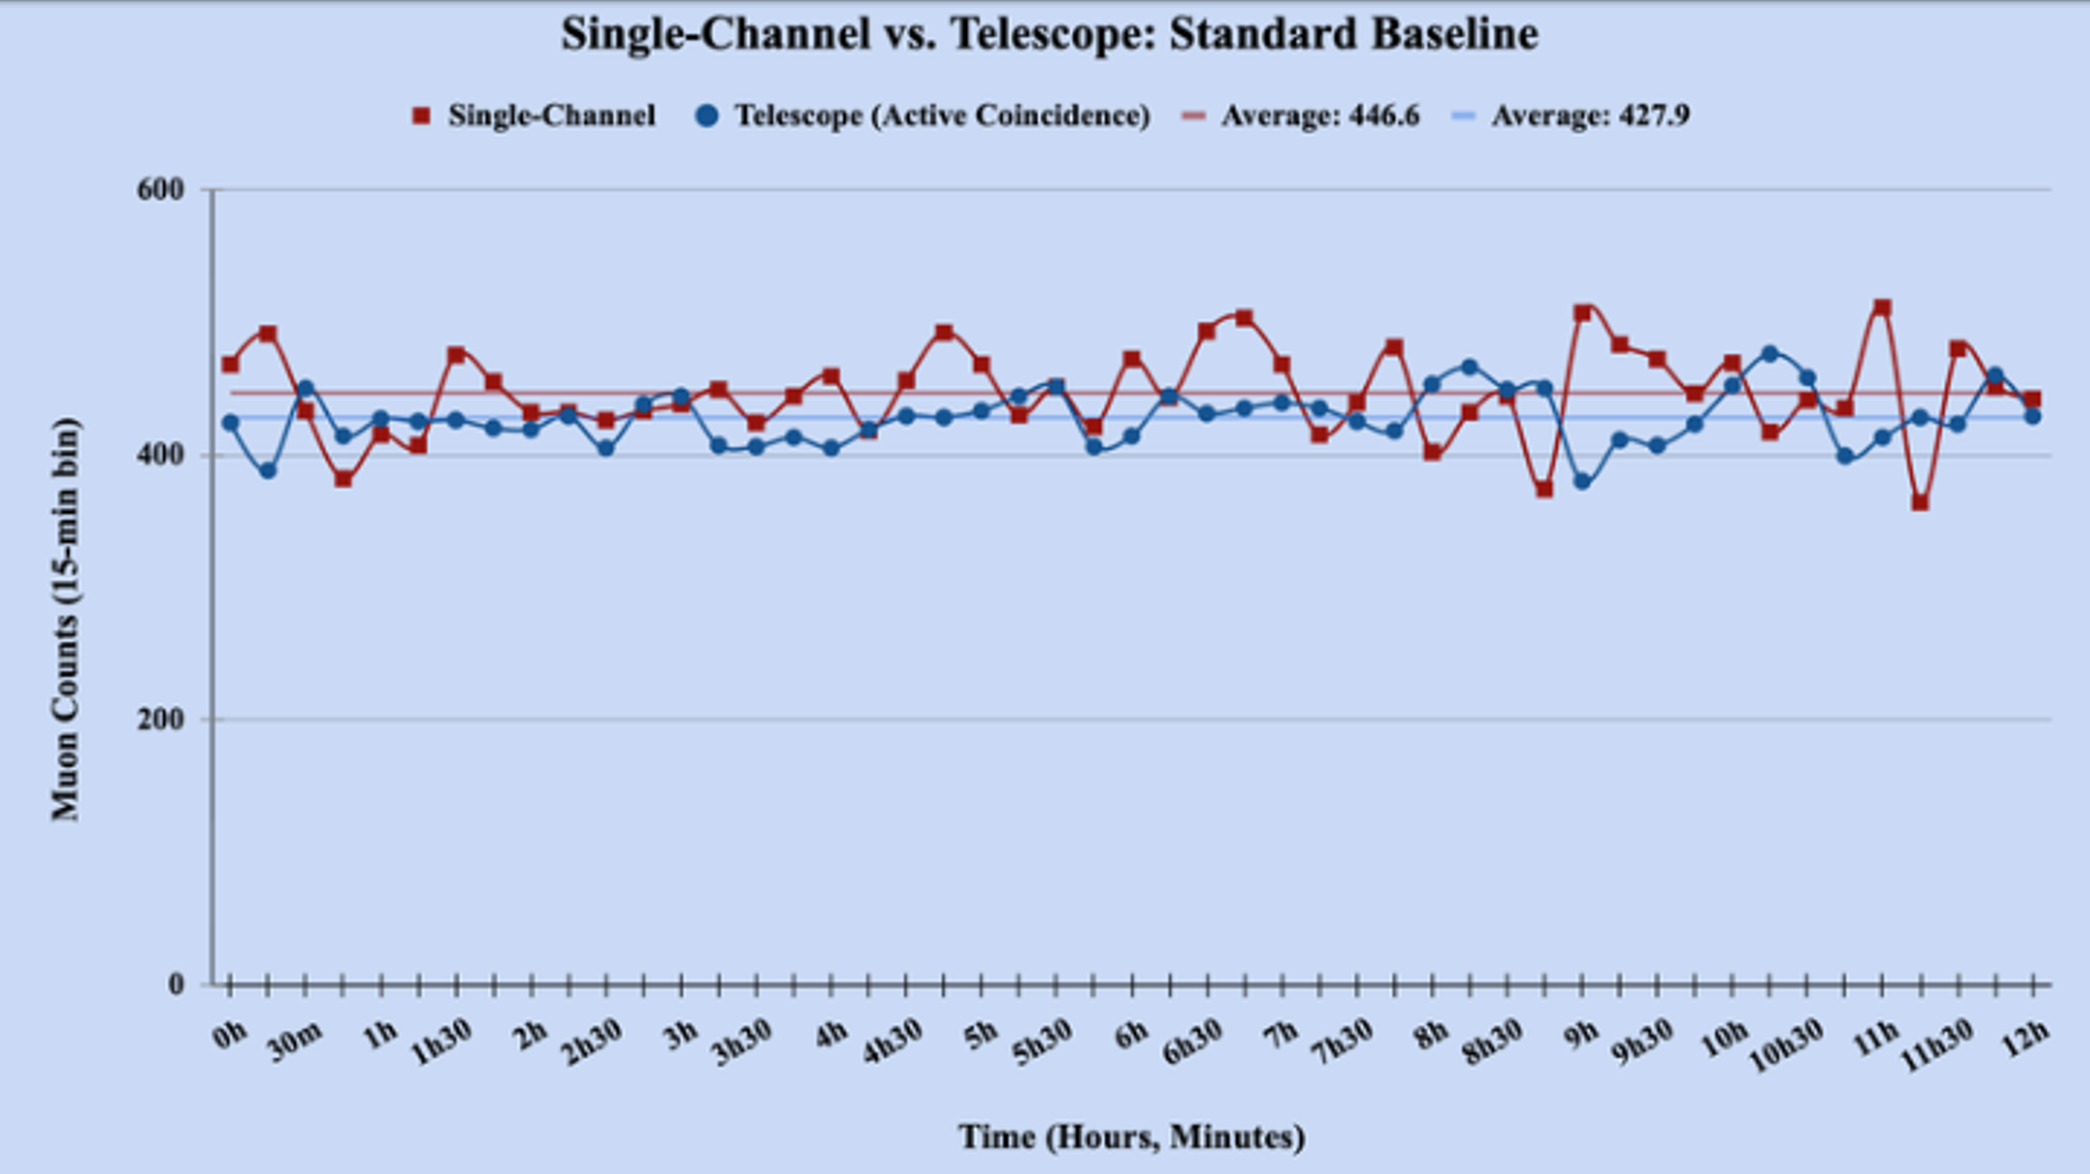
Figure 5.2: Telescope compared to single channel detection observed at an elevation of approximately 40 meters. Data was collected over the course of 12 hours on a sunny day.
Based on these tests the telescope model consistently yielded a lower muon count as it was able to eliminate particle noise by only accepting coincidence (Lechmann et al., 2021). Surprisingly, given the simplistic design of the detector, single-channel data of 0.495 counts per second (cps) was much closer to both the theoretical value of 0.417 cps and our experimental telescope setup of 0.474 cps. The reduction in count rate observed in the telescope configuration is consistent with the expected rejection of non-coincident events, including secondary electrons and low-energy electromagnetic components of cosmic ray showers (Bonechi et al., 2019). This confirms that coincidence logic acts as an effective filter for isolating true muon events, which are more likely to traverse both scintillators within the coincidence window (Axani et al., 2018). As a result, the telescope configuration provides a more physically meaningful measurement of muon flux despite reporting lower raw counts. Upon assessing baseline fluctuations it was found that the collected data at the Centennial Seawalk had a greater Poisson ratio, indicating greater fluctuations. The calculated values were 1.10 for the standard baseline and 1.71 for the seawalk baseline. This is expected as coastal conditions tend to have more frequent humidity fluctuations which may affect muon flux (Jourde et al., 2013; Su et al., 2021).
Testing under relevant media
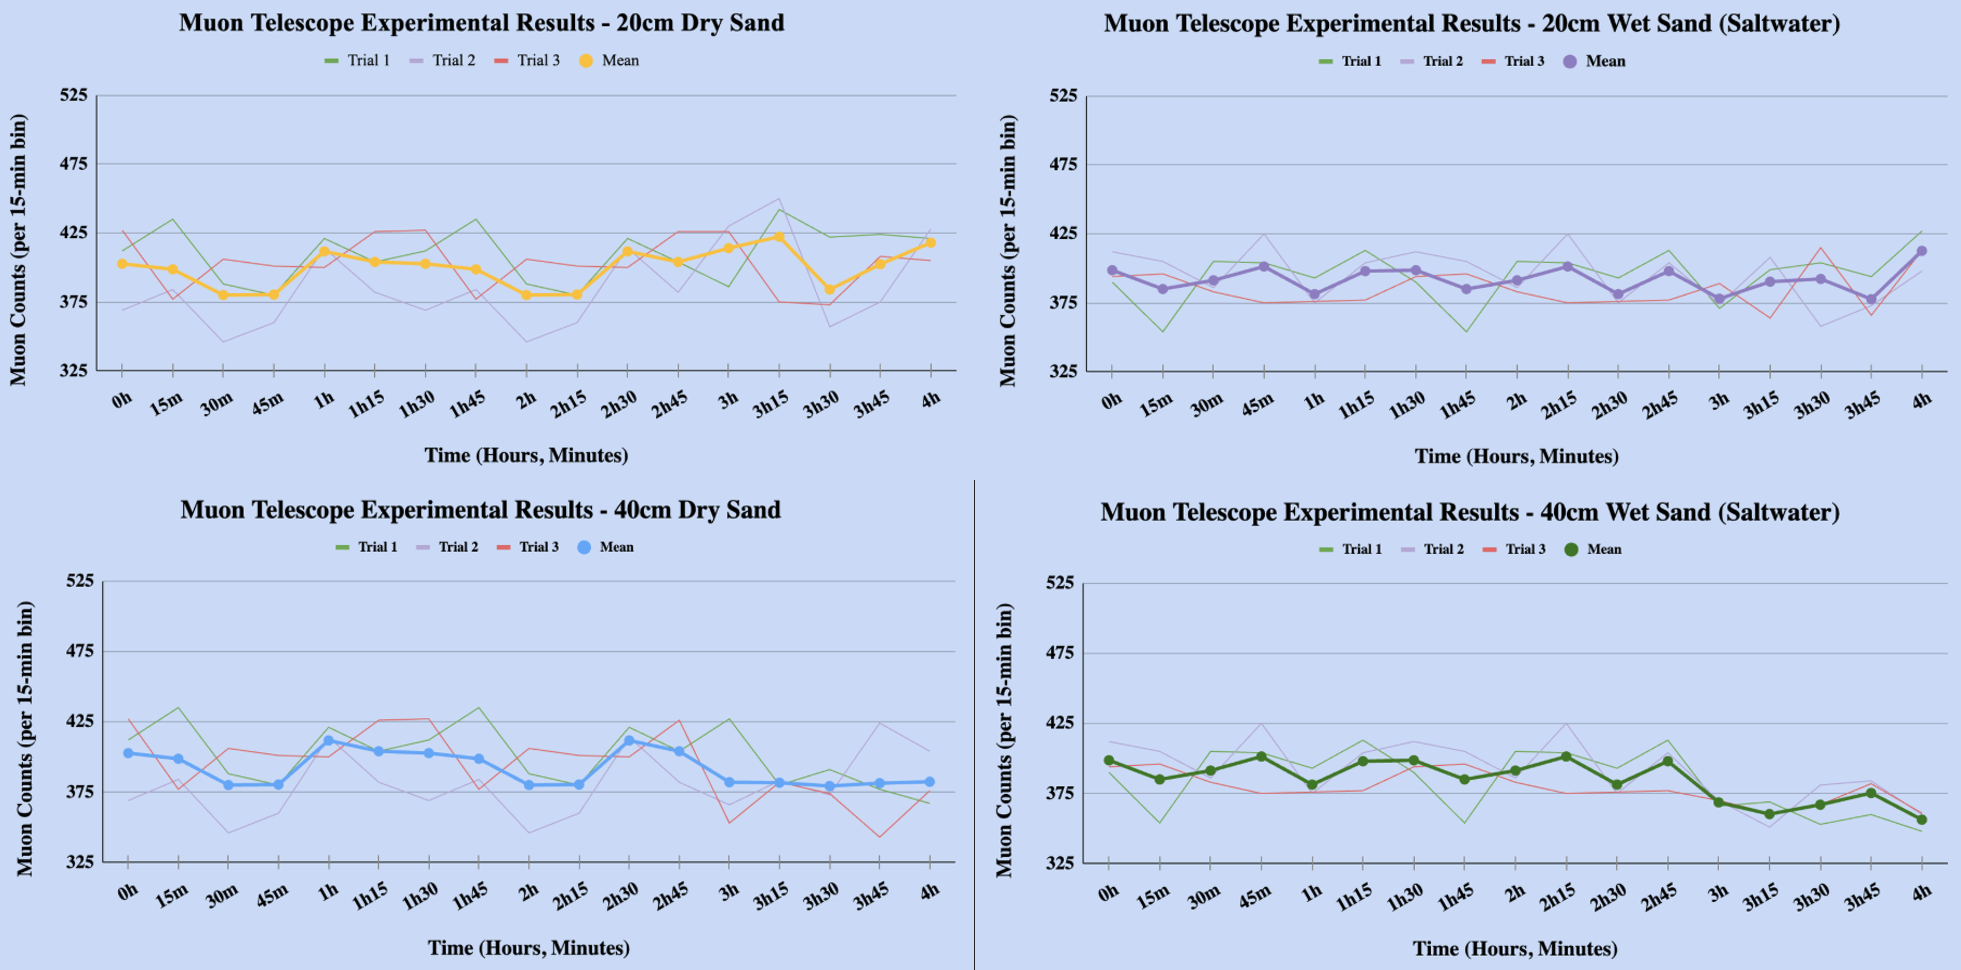
Figure 5.3: Collected muon counts across 12 trials and 4 test conditions: 40 cm Wet, 40 cm Dry, 20 cm Wet, 20 cm Dry.
Three trials for each test condition was run for 4 hours and 3 separate days. The average of the muon count was then taken to reduce the Poisson fluctuation of the data.
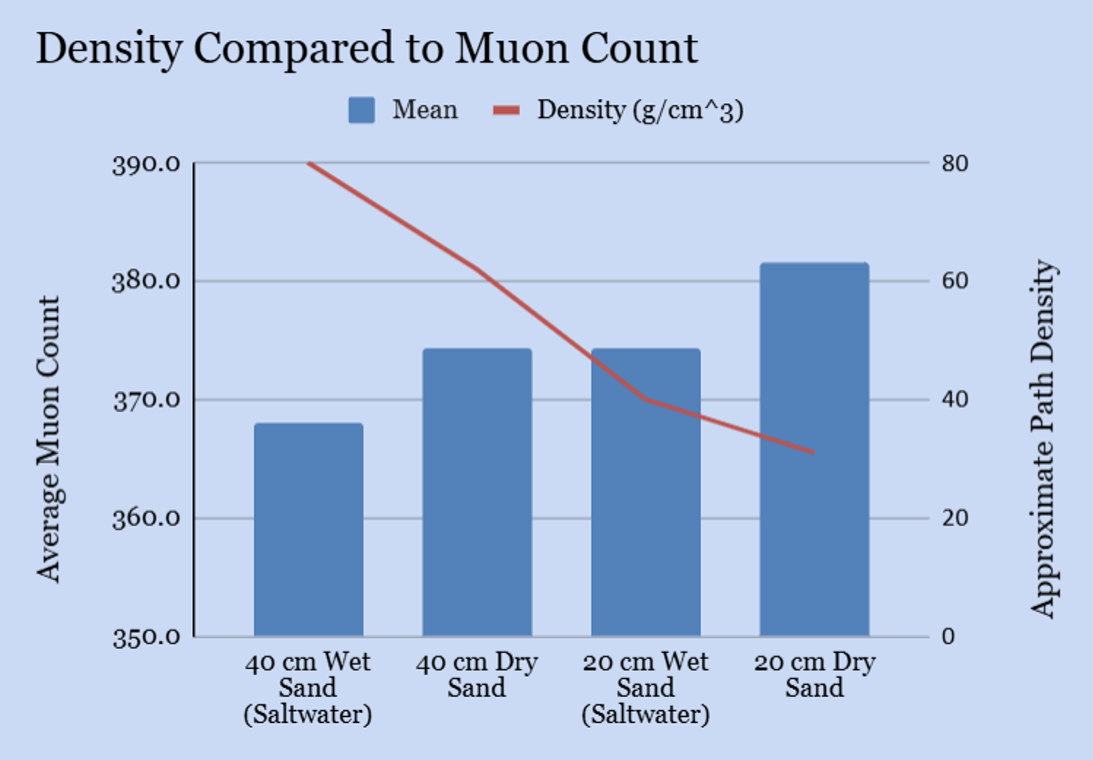
Figure 5.4: Density in grams per cubic centimeter graphed against mean muon counts from 4 test conditions.
A strong negative correlation (r = 0.91) between the density of the tested media was observed. Though the differences observed in raw counts are modest, with a z value of 1.72 for dry sand and 1.70 for wet sand, this statistical insignificance can be primarily attributed to detector size and density variance. In addition to correlation and count-based hypothesis tests, significance was also assessed by comparing the difference in mean transmission values to the combined uncertainty of the compared conditions. The principal finding of this study is that the telescope configuration suggests improved separation between dry and saltwater-saturated sand at 40 cm depth, while the same comparison at 20 cm depth does not achieve statistical significance within the present trial budget. Conversely, comparisons across depth at fixed moisture content yield clearer separation in the saltwater-saturated case, demonstrating that the telescope is sensitive to total path opacity (Lechmann et al., 2021; Lesparre et al., 2010) even when the underlying density contrast is modest.
Simulations
The particles were simulated using Geant4 version 11.4.1 (Agostinelli et al., 2003) with a total 3 different simulation setups. A baseline muon flux was simulated using a world box size of 3x3x2 meters with muon shots distributed evenly across the top side of the world box. Based on public data of sealevel flux (Su et al., 2021), the simulations assumed a flux of 1502 muons per second per 9 m2 area. The scintillators were set at a distance of 5 centimeters from one another, same as during experimental setup. The angular flux was determined using the formula (Cecchini & Spurio, 2012):
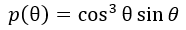
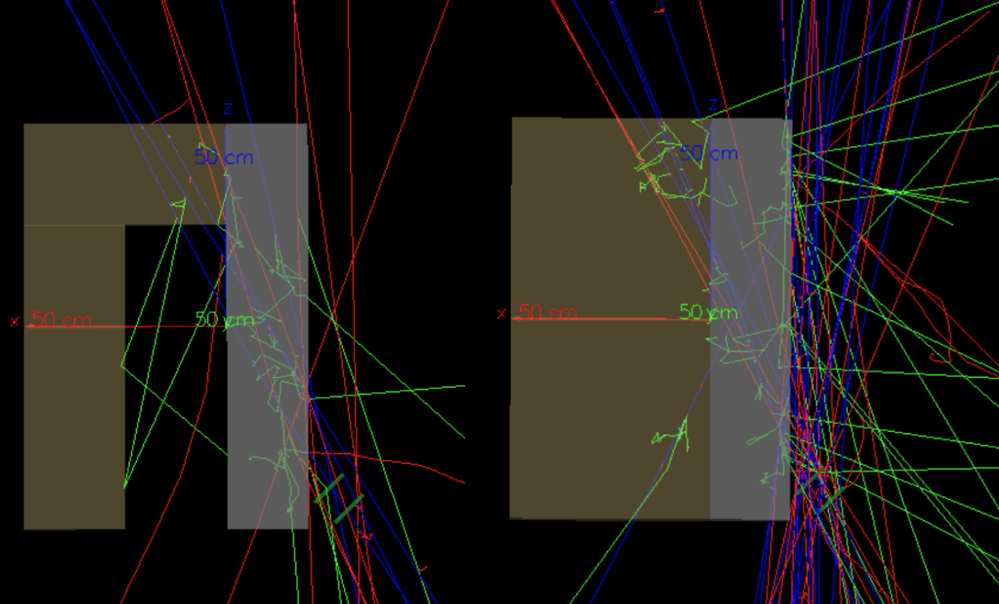
This equation was chosen as a simple approximation for the number oblique muons during simulations following prior atmospheric muon studies that represent sea-level zenith dependence with an empirical law for Monte Carlo simulations such as Geant4 (Agostinelli et al., 2003; Cecchini & Spurio, 2012; Su et al., 2021). In assessing the viability of detectors seeing anomalous backfill a simple model was set up assuming a concrete thickness of 25 cm. After running the simulation for around 1 million particles for each setup, 0.05% of which contacted the detector in coincidence (Lechmann et al., 2021). The detectors were placed at an angle of 45 degrees from the base of the at a separation distance of 5cm (optimized through several simulation attempts). By counting only coincidence particles, it eliminates noise but also ensures the particles had to pass through the simulated seawall. Ultimately, the model outputted a rate of approximately 0.188 muons per second and 0.174 muons per second for regular and anomalous backfill, respectively. Based on the muon flux of 1502 in a 9-meter cube area (Su et al., 2021), every 100000 particles equated to about 66 seconds of detection time. Consequently, within the first simulated hour, a difference of around 4.5% was observed between the missing backfill and regular backfill models.
Figure 5.5: Simulated trajectories of muons under two varying conditions. Only the trajectories of muons contacting the detector was visualized.
Conclusion
Ultimately, this technological study finds that a portable muon detector shows great promise to seawall condition assessment, which suggests the viability of muon tomography as a non-destructive evaluation technique in high-salinity coastal environments (International Atomic Energy Agency, 2023; Lechmann et al., 2021; Lesparre et al., 2010). Measuring the attenuation rates across dry sand, saltwater-saturated sand, and varying thicknesses followed the expected negative correlation between muon flux and path density (Lechmann et al., 2021; Lesparre et al., 2010), with the wet saltwater-saturated media producing consistently lower flux than their dry alternatives. The data collected verify the underlying physics of this proof-of-concept. Despite many constraints, such as instrumentation limitations, testing time, and the default baseline fluctuation of muons and the observed transmission trends remained consistent with simulation results and research. These findings establish that muon tomography offers a promising alternative to conventional methods such as GPR and seismic surveys in environments where electromagnetic attenuation and moisture variability degrade the efficacy of many existing geotechnical surveillance methods (Doolittle et al., 2007). Future work should extend integration times, incorporate larger scintillators or SiPMs to improve count statistics. With these refinements, muon tomography has the potential to become a practical tool for long-term, non-invasive monitoring of coastal infrastructure (Deng et al., 2026).
References
Agostinelli, S., Allison, J., Amako, K., Apostolakis, J., Araujo, H., Arce, P., … Zschiesche, D. (2003). Geant4—a simulation toolkit. Nuclear Instruments and Methods in Physics Research Section A: Accelerators, Spectrometers, Detectors and Associated Equipment, 506(3), 250–303. https://doi.org/10.1016/S0168-9002(03)01368-8
Axani, S. N., Frankiewicz, K., & Conrad, J. M. (2018). The CosmicWatch desktop muon detector: A self-contained, pocket-sized particle detector. Journal of Instrumentation, 13, P03019. https://doi.org/10.1088/1748-0221/13/03/P03019
Bonneville, A., Kouzes, R., Yamaoka, J., Lintereur, A., Flygare, J., Varner, G. S., Mostafanezhad, I., Guardincerri, E., Rowe, C., & Mellors, R. (2019). Borehole muography of subsurface reservoirs. Philosophical Transactions of the Royal Society A: Mathematical, Physical and Engineering Sciences, 377(2137), 20180060. https://doi.org/10.1098/rsta.2018.0060
Bonechi, L., D’Alessandro, R., & Giammanco, A. (2019). Atmospheric muons as an imaging tool (arXiv:1906.03934). arXiv. https://doi.org/10.48550/arXiv.1906.03934
Cecchini, S., & Spurio, M. (2012). Atmospheric muons: Experimental aspects. Geoscientific Instrumentation, Methods and Data Systems, 1, 185–196. https://doi.org/10.5194/gi-1-185-2012
Deng, B., Sun, G., Wang, D., & Qin, Y. (2026). Seismic and tsunami-induced stability assessment of seawalls against passive failure under varying water levels. Ocean Engineering, 354, Article 124991. https://doi.org/10.1016/j.oceaneng.2026.124991
Doolittle, J. A., Minzenmayer, F. E., Waltman, S. W., & Benham, E. C. (2007). Ground-penetrating radar soil suitability map of the conterminous United States. Geoderma, 141(3–4), 416–421. https://doi.org/10.1016/j.geoderma.2007.05.015
Guardincerri, E., Durham, J. M., Morris, C., Bacon, J. D., Daughton, T. M., Fellows, S., Johnson, O. R., Morley, D. J., Plaud-Ramos, K., Poulson, D. C., & Wang, Z. (2016). Imaging the inside of thick structures using cosmic rays. AIP Advances, 6(1), 015213. https://doi.org/10.1063/1.4940897
International Atomic Energy Agency. (2023, April 14). Muon imaging: How cosmic rays help us see inside pyramids and volcanoes. https://www.iaea.org/newscenter/news/muon-imaging-how-cosmic-rays-help-us-see-inside-pyramids-and-volcanoes
Jourde, K., Gibert, D., Marteau, J., de Bremond d’Ars, J., Gardien, S., Girerd, C., Ianigro, J.-C., & Carbone, D. (2013). Experimental detection of upward going cosmic particles and consequences for correction of density radiography of volcanoes. Geophysical Research Letters, 40, 6334–6339. https://doi.org/10.1002/2013GL058357
Khaw, K. S., Hoh, S. Y., Hu, T., Huang, X., Ng, J. K., Takeuchi, Y., Tan, M. Y., Wang, J., Wang, Y., Wong, G. M., Wu, M., Yan, N., Zeng, Y., Chen, M., Gao, S., Li, L., Shi, Y., Tan, J., Wang, Q., … Zhan, Q. (2025). Toward noninvasive sediment monitoring using muography: A pilot run at the Shanghai Outer Ring Tunnel. Journal of Applied Physics, 138(11), 114902. https://doi.org/10.1063/5.0273686
Lechmann, A., Nishiyama, R., Rascon, R. G., Oláh, L., Sitarz, S., Morishima, K., Takeuchi, Y., Tanaka, H. K. M., Jourde, K., & Marteau, J. (2021). Muon tomography in geoscientific research: A guide to best practice. Earth-Science Reviews, 222, 103842. https://doi.org/10.1016/j.earscirev.2021.103842
Lesparre, N., Gibert, D., Marteau, J., Déclais, Y., Carbone, D., & Galichet, E. (2010). Geophysical muon imaging: Feasibility and limits. Geophysical Journal International, 183(3), 1348–1361. https://doi.org/10.1111/j.1365-246X.2010.04790.x
Su, N., Liu, Y., Wang, L., Wu, B., & Cheng, J. (2021). A comparison of muon flux models at sea level for muon imaging and low background experiments. Frontiers in Energy Research, 9, 750159. https://doi.org/10.3389/fenrg.2021.750159