Linlin Li – Life Science, Year 2
Abstract
Anthocyanins, a type of natural pigment that gives plants their red, purple, and blue colours, are becoming more relevant for their antioxidant qualities and applications in the food, medicine, and cosmetics industries. This study examines the effectiveness of ultrasonic-assisted extraction (UAE) of anthocyanins from rose petals using distilled water of different pH levels (approximately 3, 6 and 9). The majority of research regarding anthocyanin extraction through UAE has focused on ethanol-water mixtures. Water is generally a preferable solvent that does not require post-processing like evaporation to address ethanol residues. Anthocyanins were extracted in a sonic bath under constant temperature for 30 minutes, after which the absorbance in the 450–600 nm region was measured by spectrophotometric analysis. Two trials’ worth of results showed that anthocyanin extracts in acidic water (pH ~3) generally showed maximum absorbance at 520 nm, which corresponds to the stable flavylium cation form of anthocyanins and is the expected peak for red rose pigments. Muted pigment colours and lower or shifted absorbance peaks (530–560 nm) were produced by neutral and basic solutions, indicating possible structural changes affecting pigment stability. However, apparatus limitations resulted in the lack of data for lower wavelengths, which would inform further conclusions about the implications of this study. The results demonstrate the possibility of distilled water as a workable solvent for cleaner extraction procedures while confirming the existing research on the acid-stability of anthocyanins. Additionally, it can be concluded that when water is the solvent, somewhat acidic circumstances are ideal for the UAE. These observations may inform future commercial procedures looking for scalable and environmentally sustainable pigment extraction techniques without compromising purity or yield.
Introduction
Anthocyanin is the primary pigment responsible for red, blue, and purple colours of plants, which arises from the absorption of light in the blue, blue-green, and green spectrums (Gould, 2004). They belong to the flavonoid family, and are a result of adding sugars to anthocyanidins. The general molecular structure of the anthocyanin compound consists of three cycles, an oxygenated heterocycle carrying hydroxyl groups, and two benzene rings (Renoult & Valeur, 2017). The most common types of this pigment found in plants consist of six aglycones: cyanidin, delphinidin, pelargonidin, peonidin, malvidin, and petunidin. All differ slightly from the general structure of anthocyanins detailed above, mainly through the number of hydroxyl groups (Mattioli et al., 2020), which can affect the color. Anthocyanins are the main pigment for the colour of dark, black-red roses (Cheng et al., 2024), and mainly composed of cyanidin, or 3,5-O-diglucoside (Ogata et al., 2005) responsible for the magenta color. They are soluble in water or acidic conditions, and its stability determines the color appearance (Renoult & Valeur, 2017), with a variety of factors changing this, including temperature and pH.
Anthocyanins are highly sought after for their applications in food, pharmaceuticals, and cosmetics. Beyond being a natural colorant, it also has antioxidant properties from its phenolic hydroxyl group, and have historically been used to treat diseases such as cardiovascular diseases, obesity, cancer, and diabetes (Kumari et al., 2022). Because these industries have a need for anthocyanins, it is essential to optimize extraction techniques in order to maximise yield and efficiency. Ultrasound-assisted extraction (UAE) has become commonly used for extracting plant pigments, including anthocyanins (Das et al., 2022). In order to break down the plant cell walls, the technique uses ultrasonic vibrations to produce tiny cavitation bubbles in the solution (Shen et al., 2023). Because of this, UAE makes it easier for anthocyanin pigments to be released into the solvent. Compared to more conventional methods, such as maceration where a plant material is soaked in a solvent to allow pigments to dissolve into the liquid extract (Tena & Asuero, 2022), using UAE produces a number of benefits. UAE has the ability to produce higher pigment concentrations, shorter extraction times, and the use of less solvent (Shen et al., 2023). These advantages make it a desirable option for industrial settings where sustainability and efficiency are essential. Furthermore, the technique’s capacity to function at regulated temperatures contributes to the preservation of anthocyanins’ structural integrity and bioactivity (Lakshmikanthan et al., 2024).
The effects of pH and co-pigment systems on anthocyanin stability and concentration were investigated by Jamei and Babaloo (2017), with emphasis on co-pigments such as coumaric, benzoic, caffeic, and tannic acids in a solution of ethanol and hydrochloric acid. Electron-rich co-pigment systems were connected to electron-deficient flavylium ions, allowing for an interaction with the anthocyanins compound in round sweet blueberries to improve colour stability and intensity while protecting the flavylium ion from water molecules’ nucleophilic attacks. The study showed that whereas neutral and basic solvents led to pigment instability and poorer yields, acidic buffers, specifically pH levels between 1 and 3, generated the maximum anthocyanin concentrations extracted (Jamei & Babaloo, 2017).
In order to maximise yield, Demirdöven et al. (2021) conducted an analysis that emphasized the importance of optimising UAE parameters including temperature, duration, and solvent concentration. For example, the study showed that, in comparison to conventional procedures, using ethanol-water solutions acidified to a pH of 3 and operating at 40°C produced 12% more anthocyanins from red cabbage (Demirdöven et al., 2015). The better performance of probe-based UAE over bath-based UAE was another noteworthy discovery. Higher anthocyanin recovery rates from jambolan fruits were attained by probe-based UAE because of its more efficient localisation of ultrasonic energy; up to 60.5 mg of cyanidin-3-glucoside equivalents per gram of dry weight were obtained, as opposed to 54.2 mg with bath-based UAE (de Sousa Sabino et al., 2021).
Tena and Asuero (2022) also provided a thorough chart of the ideal UAE conditions for a variety of natural matrices. It encapsulates important variables including temperature, solvent composition, extraction duration, liquid-to-solid (L/S) ratio, and ultrasonic power, as well as how these affect the yield and purity of anthocyanins. These parameters offer a framework for developing and refining anthocyanin extraction techniques for specific plant species and solvent systems. For example, the importance of solvent composition was emphasised, showing that anthocyanin recovery is better with acidified ethanol-water mixtures, typically pH 3 (Tena & Asuero, 2022). This is consistent with the requirement for acidic circumstances to stabilize the anthocyanins’ active form, the flavylium cation (Khoo et al., 2017). Diglucoside recovery was the highest when anthocyanins were extracted from jambolan fruit using a probe ultrasound system. This shows how exact control of ultrasonic power and solvent characteristics can maximise the extraction of particular anthocyanin derivatives. Similarly, the extraction from red cabbage using a 42.39% ethanol-water mix yielded anthocyanins efficiently, with an increase of up to 12% compared to conventional methods (Tena & Asuero, 2022). Temperature and time factors are shown to be especially relevant when using different plant materials and solvents (Tena & Asuero, 2022). Higher temperatures can be used without breaking down sensitive chemicals, as shown by the best extraction from purple sweet potatoes at 60°C using a 90% ethanol solution (acidified with HCl), as long as other parameters are well managed. On the other hand, fig peel extraction worked best at moderate temperatures between 30 and 35°C (Tena & Asuero, 2024).
The majority of research has concentrated on ethanol-water mixes or conventional maceration techniques, even though earlier studies have shown that acidic conditions (approximately pH 3) generally improve anthocyanin extraction in various natural materials including passion fruit (Tan et al., 2022) and jaboticaba berries (Chua et al., 2024). The effects of pH changes in pure distilled water solvents when extracting anthocyanin from roses using UAE have not been thoroughly studied. Due to its non-toxicity, water is a preferable solvent for applications in food and pharmaceuticals because it does not require further purification processes like evaporation to eliminate the ethanol residues in ethanol-water mixtures (Johnson et al., 2002). Considering the pH of a solvent is particularly relevant for anthocyanins because these pigments experience changes in structural forms and stabilities at different pH levels (Tena & Asuero, 2022). Because ethanol can affect the solubility and interactions of anthocyanins, using water alone also makes it possible to observe the impact of pH on extraction efficiency more clearly.
The purpose of the present study is to use UAE to examine how the pH of the distilled water solvent affects the effectiveness of anthocyanin extraction from rose petals. To quantify the extracted anthocyanins, absorbance measurements comparing the pigments at pH values of approximately 3, 6, and 9 will be conducted using a spectrophotometer, which operates based on the Beer–Lambert law. The law describes how the intensity of light is reduced or how much is absorbed depending on the material it is traveling through (Mayerhöfer et al., 2020). It is a combination of Beer’s law, which states that absorbance and concentration are proportional, as well as Lambert’s law, where the path length of absorption of light is proportional. The formula is given by Equation (1):

where A is absorbance, ![]() is molar absorptivity, b is length of light path, and C is concentration. The general relationship shown through the variables indicates that the absorbance of a measured solution does not depend on the volume of the sample in the cuvette. The absorbance and molar absorptivity would inherently change depending on the solvent used. The path length is dependent on the size of the cuvette, which is constant due to the identicality of the cuvettes used. Finally, the concentration of the solution used will be consistent for each solvent type. From this it can be inferred that the volume of liquid used in each reading will not have a significant impact on the results. Literature values state that the optimal absorption peak of the anthocyanins found in red roses fall within the 520 – 535 nm range (Yokoi & Saitô, 1973). As such, the spectrophotometer will be used to observe which pH yields the highest absorption at this range.
is molar absorptivity, b is length of light path, and C is concentration. The general relationship shown through the variables indicates that the absorbance of a measured solution does not depend on the volume of the sample in the cuvette. The absorbance and molar absorptivity would inherently change depending on the solvent used. The path length is dependent on the size of the cuvette, which is constant due to the identicality of the cuvettes used. Finally, the concentration of the solution used will be consistent for each solvent type. From this it can be inferred that the volume of liquid used in each reading will not have a significant impact on the results. Literature values state that the optimal absorption peak of the anthocyanins found in red roses fall within the 520 – 535 nm range (Yokoi & Saitô, 1973). As such, the spectrophotometer will be used to observe which pH yields the highest absorption at this range.
Materials and Methods
Extracting pigment through UAE
Since the primary purpose of this experiment was to compare the UAE results between the distilled water solvents of varying pH, the specific mass of plant material used is not significant as long as the ratio of solid to liquid is constant. When preparing the roses for the maceration process, only the petals were taken from the flower. With a mortar and pestle, three roses worth of petals were crushed until a pulpy state was achieved. The total mass was then weighed using a scale, coming to 32.51 ± 0.01g, and separated into three equal parts 10.50 ± 0.01g each.
The initial pH of the distilled water was measured with a pH probe (Dr. Meter) to be 6.34. Using a 1:20 solid to liquid ratio, three samples of 210 ml of distilled water were placed into three sealable glass containers labeled with pH 3, 6, and 9. In the pH 3 container, 0.05g of anhydrous citric acid (Yogti) was used to change the pH from 6.86 to 3.15. In the pH 9 container, 0.60 g of Arm & Hammer sodium bicarbonate changed the pH to 9.27. The three separated parts of rose material were placed into these three containers. Next, the glass containers were placed into the Crewworks ZX-0.31 ultrasonic cleaner. The solutions were allowed to undergo UAE at 85°F for 30 minutes. Afterwards, each was strained with filter paper to remove any solid debris and separate extract from plant material into a clean, separate glass beaker. The process of extraction was repeated twice with two batches of roses. Results are separated by “Trial 1” and “Trial 2” in the results section.
Generating absorbance spectra through UV-Vis spectrophotometer
For each solvent, the absorbance for a range of wavelengths from 450-600 nm were measured in 10 nm increments using a spectrophotometer. The calibration of the spectrophotometer involved using a cuvette filled with distilled water as a blank for every change in wavelength. A pipette was used to pick up the filtered extract in the glass beaker and fill the cuvette to two thirds of its volume capacity for each solvent, although specific volume is not significant according to the Beer-Lambert law. For each wavelength, the absorbance was measured twice using two separate samples of each solvent.
Results
The results below consist of the absorbance mean and standard deviation of two separate trials. Between these two trials, there was an error made regarding the cuvette used as blank. In one trial an empty cuvette was used, while in the other a cuvette filled with distilled water was used. Due to this inconsistency in methods, the results could not be averaged over the two trials and instead had to be averaged within each trial. The first spectrophotometric analysis trial showed differences in the recorded maximum absorption values for extracting anthocyanins using distilled water of different pH. As seen in Table 1, for pH 3.15, the highest recorded absorbances in both sample 1 and 2 were at 520 nm, with an average value of 0.932 . For pH 6.34 the highest absorbances were recorded at 530 nm, with an average value of 0.9265. Finally, the highest recorded absorbance for pH 9.27 was at 540 nm, where sample 2 showed an absorbance of 1.231. However, here the data for sample 1 displayed “Over,” meaning exceeding the measurable limit. The next highest absorption for both samples was at 550 nm, with an average value of 1.2175. The differences in maximum absorbance is shown in Figure 1. It can be observed that pH 6.34 was the only value that showed a clear peak in its absorption spectrum. After UAE, all three samples displayed visible differences in colour shown in Figure 2. The extracted pigment in pH 3.15 was a vibrant red-orange colour, while the other two were muted brown, with the pH 6.15 solution being slightly darker than pH 9.27 (Figure 2). The two samples per pH level were used to calculate the standard deviation values. In Trial 1, there was minimal variation between samples of the pH 3.15 solution, as the comparatively low standard deviations ranged from 0.0057 to 0.0552 (Table 1). Particularly at longer wavelengths, where the variability increased, the standard deviations for pH 6.34 and pH 9.27 were marginally greater (Table 1).
Table 1: Mean absorbance and standard deviations of absorbance values from 450 to 600 nm of two anthocyanin samples extracted in distilled water of pH 3.15, 6.34, and 9.27 using UAE. All absorbance readings below 520 nm from the spectrophotometer displayed “Over” and were omitted from the table. Standard deviations were calculated from two samples taken from each extracted solution. Cells left blank indicate the “Over” reading and thus no standard deviation could be calculated.
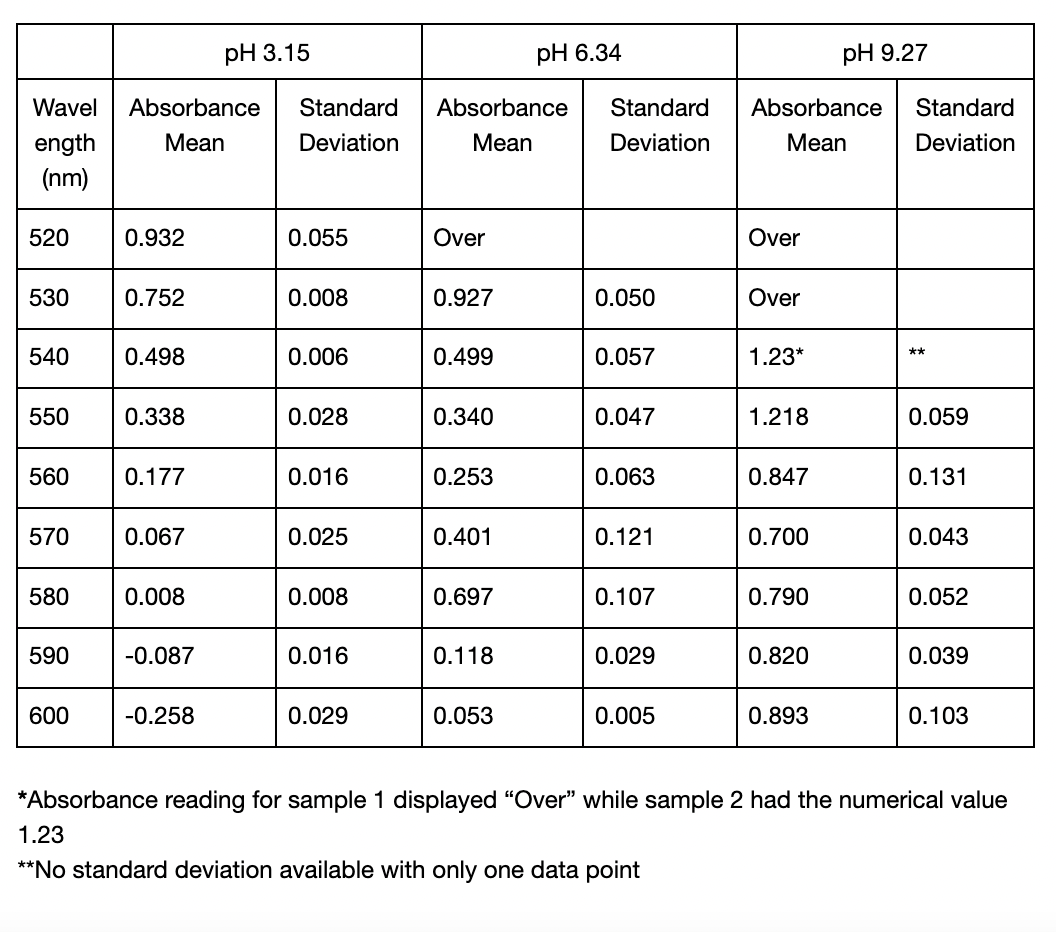
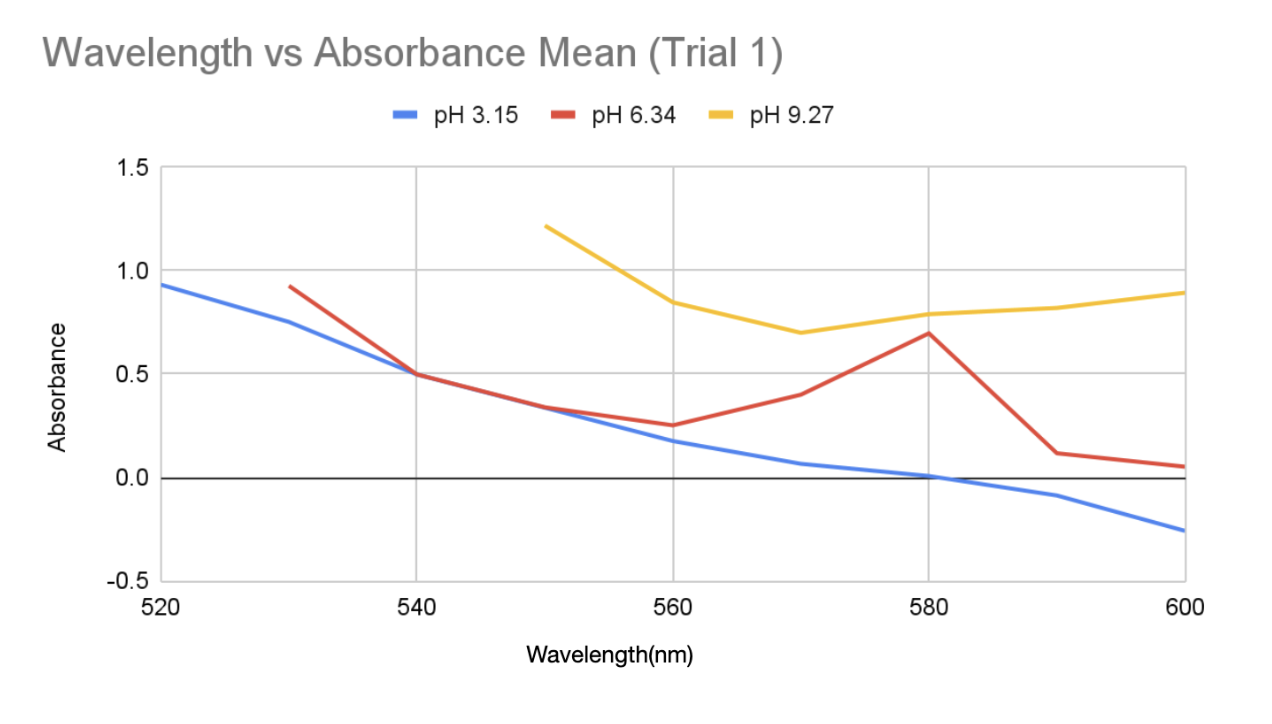
Figure 1: Graph of Wavelength vs Absorbance Mean for anthocyanin pigment extracted in distilled water of pH 3.15, 6.34, and 9.27 in Trial 1
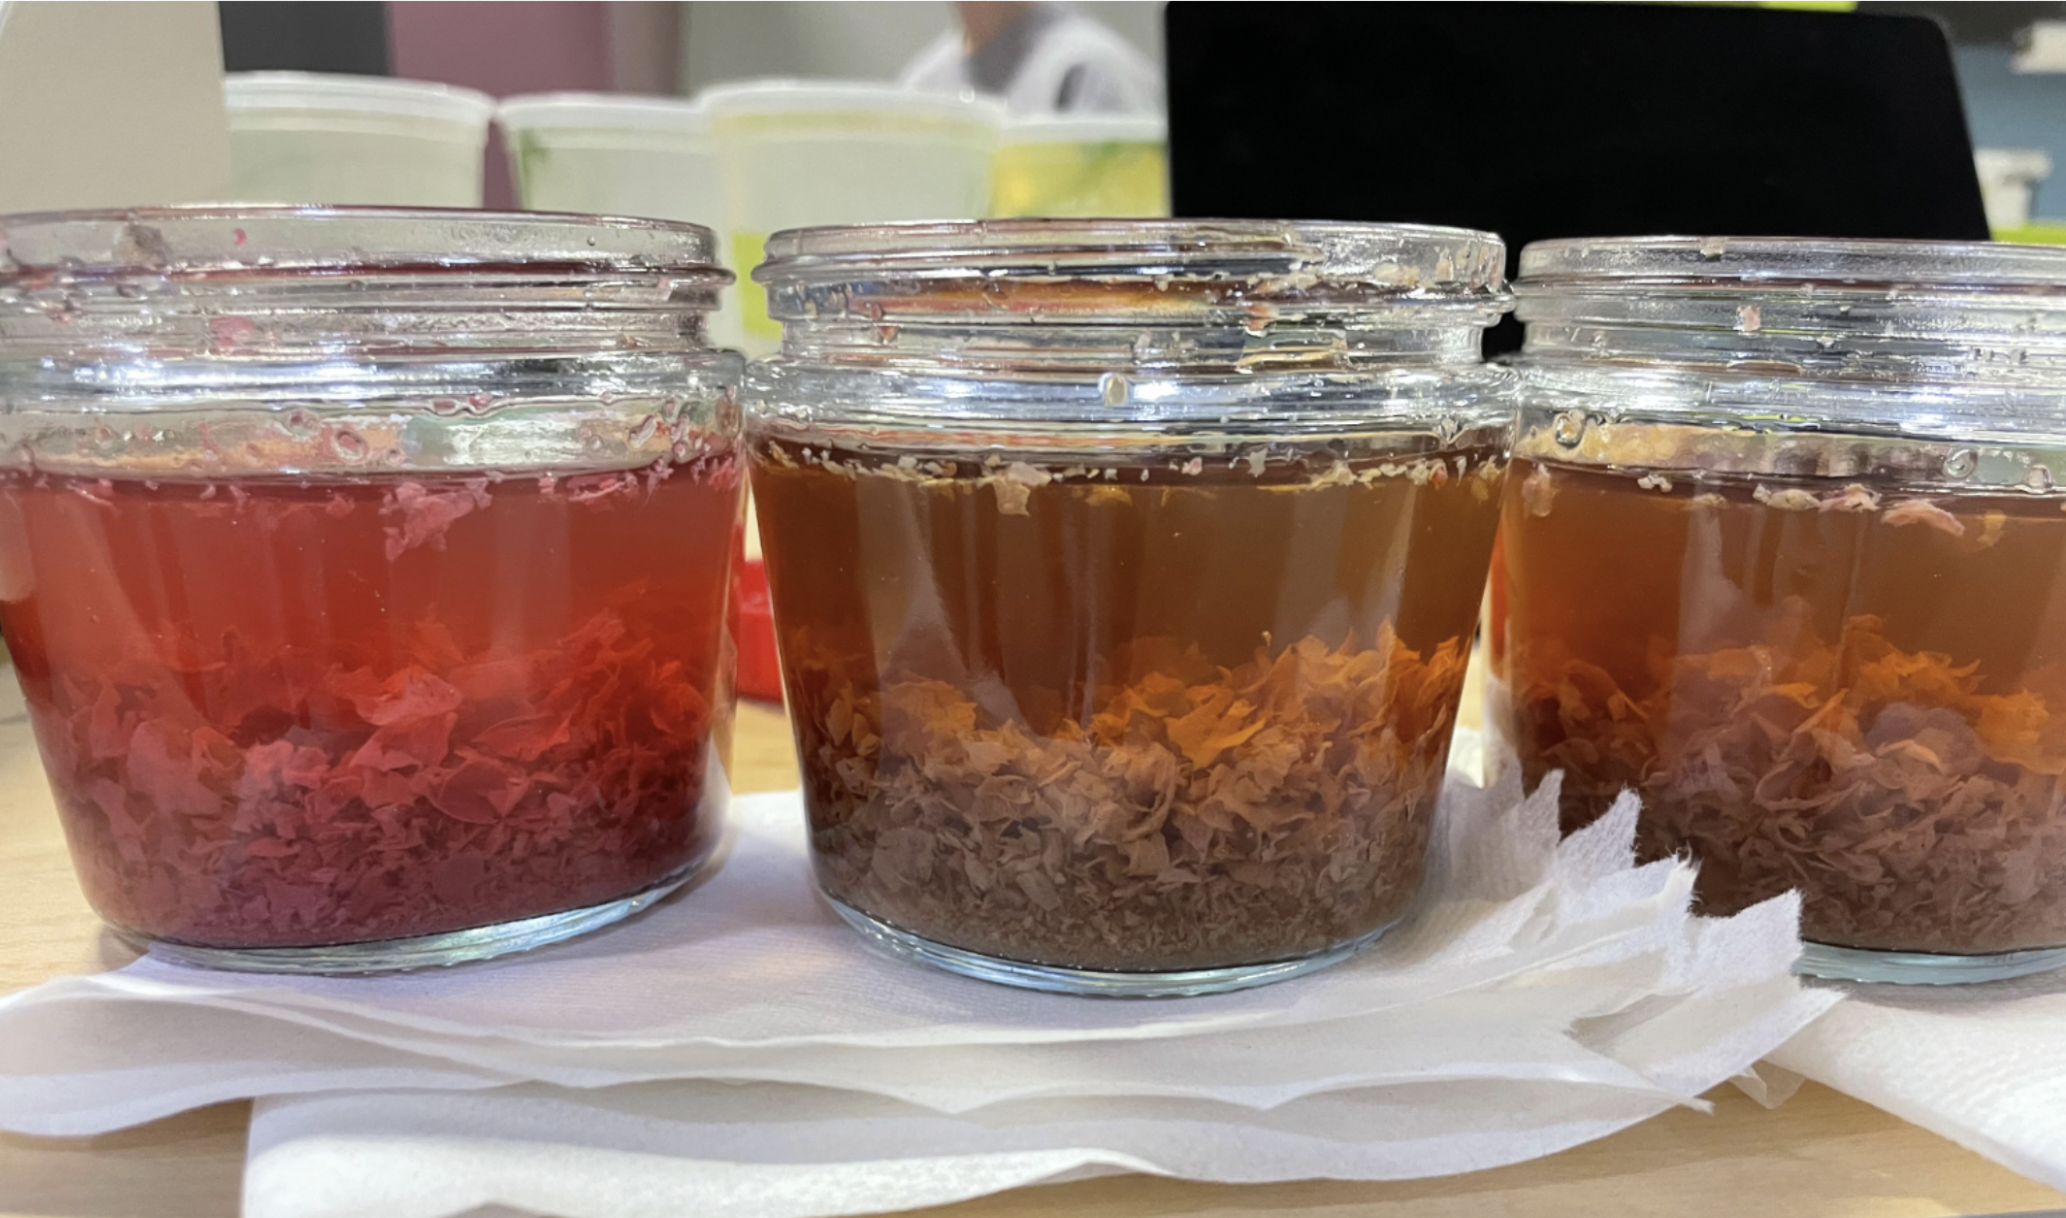
Figure 2: Qualitative results of trial 1 showing the colour of anthocyanin extracted in distilled water after UAE (pH of distilled water used from left to right: 3.15, 6.34, 9.27)
In the second spectroscopic analysis (Trial 2), the highest recorded absorbance for pH 3.21 occurred at a wavelength of 520 nm with an average value of 1.3015 as seen in Table 3. For pH 6.09, the peak absorbance was at 510 nm, where sample 2 displayed 1.726, but sample 1 was “Over”. If this data is not taken into account, the absorbance peaked at 520 nm in this study with an average of 1.135 (Table 2). The highest absorbance recorded for pH 9.17 was at 560 nm with an average of 0.431. Similar to Trial 1, the extracted solutions had variations in color. The pH 3.21 solution was a red-orange hue, while pH 6.09 and pH 9.17 solutions resulted in more muted brown tones (Figure 2). In Trial 2, there was more variation in standard deviations across wavelengths. For pH 3.21, values ranged from 0.0035 to 0.7389, and pH 6.09 had higher deviations, particularly at 600 nm (0.9723) (Table 2). For pH 9.17, the deviations remained relatively low, with a maximum of 0.1167 at 570 nm (Table 2).
Table 2: Mean absorbance and standard deviations of absorbance values from 450 to 600 nm of anthocyanin extracted in distilled water of pH 3.21, 6.09, and 9.17 using UAE. All readings below 510 from the spectrophotometer displayed “Over” and were omitted from the table. Standard deviations were calculated from two samples taken from each extracted solution. Cells left blank indicate the “Over” reading and thus no standard deviation could be calculated.
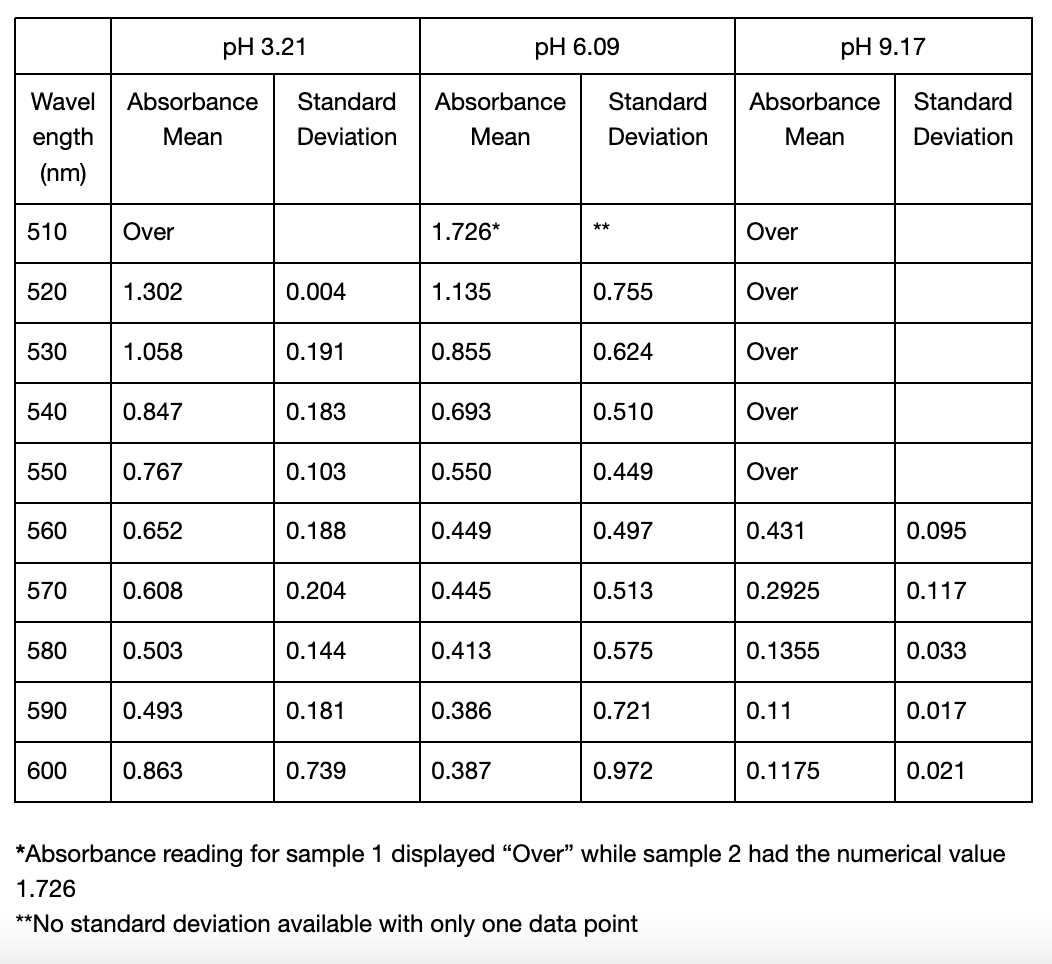
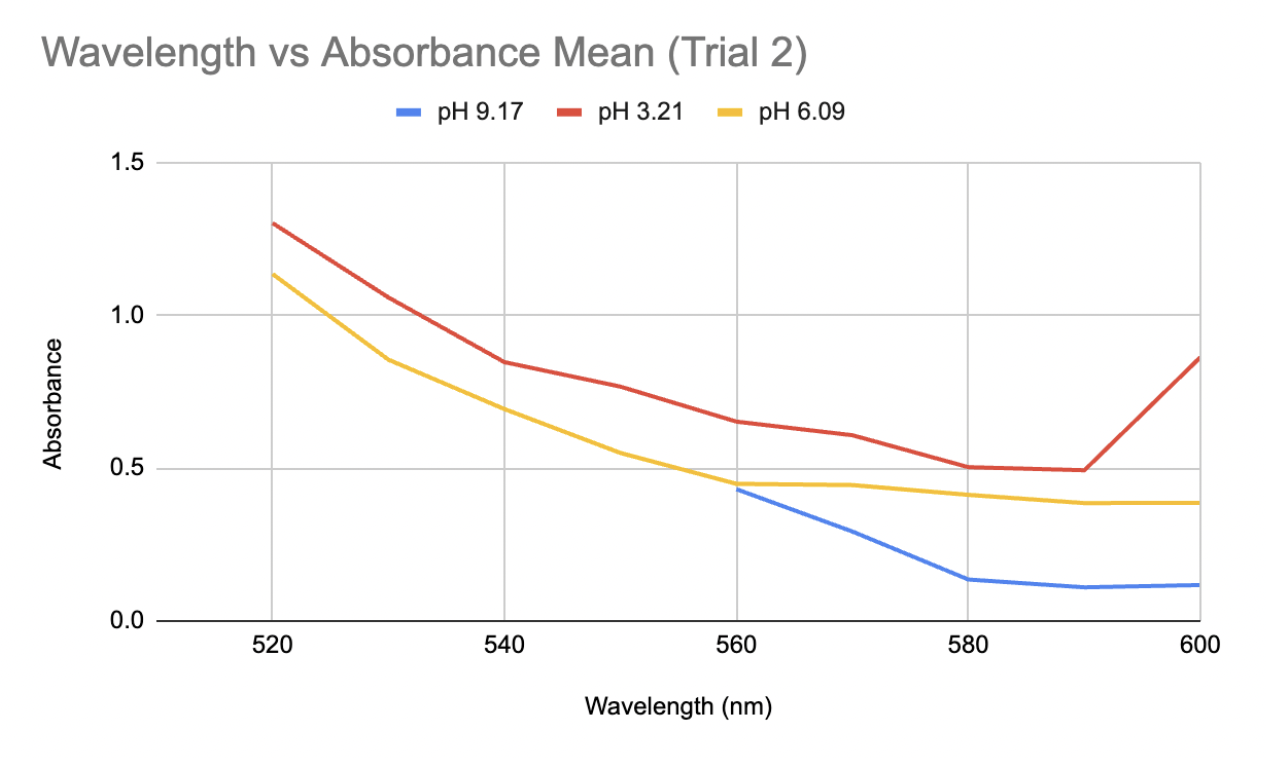
Figure 3: Graph of Wavelength vs Absorbance Mean for anthocyanin pigment extracted in distilled water of pH 3.21, 6.09, and 9.17 in Trial 2.
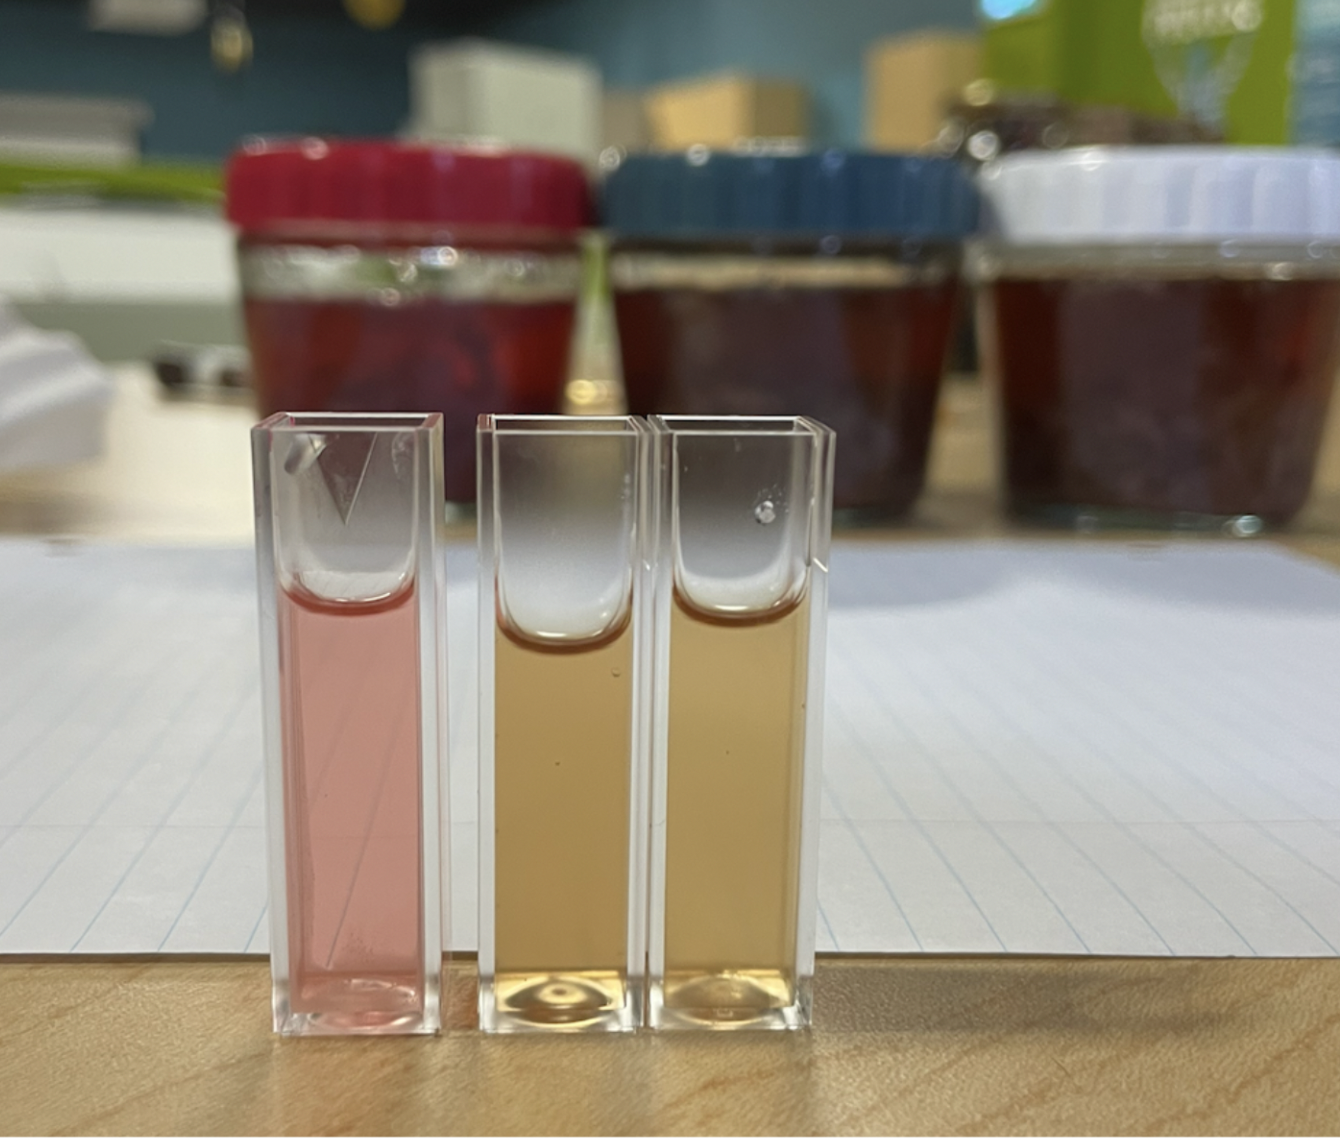
Figure 4: Qualitative results of trial 2 showing the colour of anthocyanin extracted in distilled water after UAE (pH of distilled water used from left to right: 3.21, 6.09, 9.17)
Discussion
The recorded values point to a potential shift and increase in the wavelength of maximum absorption when pH rises, but this conclusion cannot be confirmed definitively because of the spectrophotometer’s limited range. All the samples displayed the “OVER” reading at lower wavelengths so it’s possible that the maximum absorbance happened below the range that this apparatus could measure. The highest absorbance that could be found in this investigation, however, was at about 520 nm for low pH (about 3), and it shifted toward longer wavelengths at higher pH values in many cases. The findings are generally consistent with anthocyanins’ known structural changes (Khoo et al., 2017), which is explained by how the anthocyanin molecule’s polarity changes as pH modifies their ionization states (Mattioli et al., 2020). The flavylium cation form of anthocyanins, which is strongly polar and absorbs at its maximum wavelength of 520 nm, is mainly found in acidic environments such as pH 3.15 and is responsible for the red and purple colors (Enaru et al., 2021). This property is seen qualitatively through the colour difference of the pH 3.15 solution after UAE in Figure 1 and pH 3.21 solution in Figure 2. The flavylium cation’s high polarity comes from the positively charged oxygen atom, and is therefore more soluble in aqueous solvents, where “like dissolves like.” The maximum recorded absorbance in Trial 1 shifted from 520 nm at pH 3.15 to 540 nm at pH 9.27 (Table 1).
Likewise, it also shifted in Trial 2, from 520 to 560 nm (Table 3). As the pH increases and the solution becomes more basic, the flavylium cation loses protons and forms the neutral quinoidal base, indicating a bathochromic change caused by the molecules’ transition (Enaru et al., 2021). However, not all samples followed this trend. In Trial 2, the pH 6.09 solution recorded a maximum at 510 nm for one of the readings, which is below the expected 520–535 nm range (Yokoi & Saitô, 1973). The pigment extracted from red roses using distilled water of pH 3.14 and 6.34 in Trial 1 both fall into the optimal range of absorption maximum. These results with the two lower pH values are somewhat expected, as the general agreement in literature is that acidic solvents have been shown to be more effective in extracting anthocyanins. However, since other papers including Demirdöven et al. (2021), and Tena and Asuero (2022) used water-based solvents that are mixtures with other chemicals, this result of a more neutral pH 6.34 being included in the optimal range may be due to the use of pure distilled water. Since the data at pH 6.09 in Trial 2 was slightly different, more trials and data is needed. With the limited data, it is not possible to know if the absorption peak lies at 510 nm or perhaps a lower wavelength. Additionally, the highest absorbance for the approximately pH 9 solutions between Trials 1 and 2 was different. The peak for pH 9.17 in Trial 2 was 560 nm (Table 3), which does not fully align with the bathochromic shift observed in Trial 1. This shows that additional factors are involved in obtaining the results, such as variations in the extraction process or even the roses used.
In terms of limitations of the experiment, the spectrophotometer’s calibration may be a cause for systematic errors. If the reference material or baseline was not appropriately set – for instance, using a dirty blank or improper placement in the device – the result could be variances in absorbance measurements. For certain samples, the absorption values across the entire measured spectrum would be greater compared to other samples. For example, sample 2 of distilled water at pH 9.27 resulted in absorption values that were almost always lower than sample 1 (Table 1.3 in appendix) . This is also seen for pH 6.09 in Trial 2 (Table 2.2 in appendix) While taking the average of the total trials may minimize these errors, it is still important to acknowledge its presence as it may affect the precision of the results. Additionally, the negative absorbance values at wavelength 590 and 600 nm of the solution containing pH 3.15 distilled water (Table 1) and sample 2 for pH 6.09 (Table 2.2 in appendix) may also indicate a possible calibration error. Going back to the Beer-Lambert Law, absorption can also be defined using variables I0 for incident intensity and I for transmitted intensity (Mayerhöfer et al., 2020):

As such, the negative absorption values seen from the solvent indicate that the transmitted intensity of light is larger than the light incident on the sample. This suggests that the spectrophotometer could have misinterpreted the material as producing light rather than absorbing it. A large part of the source of calibration errors can also be associated with the cuvette used as the blank. The data obtained from the spectrophotometer varied greatly between the two trials, which is likely due to a method error of using an empty cuvette as a blank for one trial and one filled with distilled water for the other. In both cases, empty plastic cuvettes were used, but plastic as a material is more prone to scratches and imperfections, which can scatter light and affect absorbance readings. While this may still allow the data to be precise, where the errors are constant, the accuracy can be negatively affected, such bringing the results further from the literature value. Despite selecting relatively smooth cuvettes, small imperfections may still affect the data, particularly taking into account the sensitivity of the spectrophotometer to three decimal places of absorption. Additionally, the water affects light through refraction, so the mistake in the lack of control between the calibration cuvettes likely caused larger systematic error between the two trials.
Standard deviation analysis can be used to evaluate the variability between trials. Variations in absorbance measurements across wavelengths are shown by the calculated standard deviations (Tables 2 and 4). Standard deviations were generally smaller for lower pH values. For example, the pH 3.15 solution in Trial 1 had deviations mainly below 0.06, which would indicate reasonably consistent measurements across samples (Table 2). However, for Trial 2, the standard deviation values for the lowest pH are all around 0.1-0.2, with the highest around 0.74 at 600 nm and lowest 0.0035 at 520 nm. Some values for the standard deviations for pH 6.34 and pH 9.27 in Trial 1 were more than 0.1, suggesting increased variation between the data collection for the two samples. This pattern was more noticeable in Trial 2, where there were large variations in pH 6.09, especially at higher wavelengths where the standard deviation was 0.972 at 600nm (Table 4). Much of the data varied across the two trials, and more data is needed to come to any conclusion about the stability of absorbance readings.
While the two trials of this experiment follow current data of solutions with lower pH being efficient for extracting anthocyanins, the effect of a neutral distilled water solution could not be fully explored in this research. In Trial 1, the absorption peak for a neutral pH value fell within the optimal wavelength range, while in Trial 2 the data did not. To further investigate this relationship, additional trials under more detailed pH and wavelength intervals could be conducted as future research. Since anthocyanins are frequently used as antioxidants and natural colourants, improving extraction techniques can in turn improve product sustainability and quality. Exploring the benefits of pure water as the solvent for extraction of anthocyanins from roses is especially relevant in certain industries as water is more food safe than ethanol-water mixtures. Conventional extraction techniques necessitates an extra step in removing the ethanol from the pigment through evaporation, which may affect the quality of the pigment and cause potential safety concerns. Additionally, knowing how pH affects anthocyanin structure will help these companies develop better formulations that can incorporate the findings and create higher pigment stability under different manufacturing conditions.
References
Cheng, Y., Tian, Y., Guo, P., Luo, J., Xu, C., Zhang, Y., Chen, G., Xie, Q., & Hu, Z. (2024). Novel Insights into Pigment Composition and Molecular Mechanisms Governing Flower Coloration in Rose Cultivars Exhibiting Diverse Petal HuesI. Plants. https://doi.org/10.3390/plants13233353
Chua, L. S., Thong, H. Y., & Soo, J. (2024). Effect of pH on the extraction and stability of anthocyanins from jaboticaba berries. Food Chemistry Advances. https://doi.org/10.1016/j.focha.2024.100835
Das, P., Nayak, P. K., & Kesavan, R. K. (2022). Ultrasound assisted extraction of food colorants: Principle, mechanism, extraction technique and applications: A review on recent progress. Food Chemistry Advances. https://doi.org/10.1016/j.focha.2022.100144
Demirdöven, A., Özdoğan, K., & Erdoğan-Tokatlı, K. (2015).Extraction of Anthocyanins from Red Cabbage by Ultrasonic and Conventional Methods: Optimization and Evaluation. Journal of Food Biochemistry. https://onlinelibrary.wiley.com/doi/abs/10.1111/jfbc.12153
de Sousa Sabino, L. B., Filho, E. G. A., André Narciso Fernandes, F., de Brito, E. S., & de Silva Júnior, I. J. (2021). Optimization of pressurized liquid extraction and ultrasound methods for recovery of anthocyanins present in jambolan fruit (Syzygium cumini L.). Food and Bioproducts Processing. https://doi.org/10.1016/j.fbp.2021.02.012
Enaru, B., Dretcanu, G., Pop, T. D., Stanila, A., & Diaconeasa, Z. (2021). Anthocyanins: Factors Affecting Their Stability and Degradation. Antioxidants. https://doi.org/10.3390/antiox10121967
Gould, K. S. (2004). Nature’s Swiss Army Knife: The Diverse Protective Roles of Anthocyanins in Leaves. Journal of Biomedicine & Biotechnology. https://pmc.ncbi.nlm.nih.gov/articles/PMC1082902/
Jamei, R., & Babaloo, F. (2017). Stability of blueberry (Cornus mas – Yulyush) anthocyanin pigment under pH and co-pigment treatments. International Journal of Food Properties. https://doi.org/10.1080/10942912.2016.1233116
Johnson, R. A., Sun, J. C., & Sun, J. (2002). A pervaporation–microfiltration–osmotic distillation hybrid process for the concentration of ethanol–water extracts of the Echinacea plant. Journal of Membrane Science. https://doi.org/10.1016/S0376-7388(02)00322-8
Khoo, H. E., Azlan, A., Tang, S. T., & Lim, S. M. (2017). Anthocyanidins and anthocyanins: colored pigments as food, pharmaceutical ingredients, and the potential health benefits. Food & Nutrition Research. https://doi.org/10.1080/16546628.2017.1361779
Kumari, P., Raju, D. V., Prasad, K. V., Saha, S., Panwar, S., Paul, S., Banyal, N., Bains, A., Chawla, P., Fogarasi, M., & Fogarasi, S. (2022). Characterization of Anthocyanins and Their Antioxidant Activities in Indian Rose Varieties (Rosa × hybrida) Using HPLC. Antioxidants. https://www.ncbi.nlm.nih.gov/pmc/articles/PMC9598279/
Lakshmikanthan, M., Muthu, S., Krishnan, K., Altemimi, A. B., Haider, N. N., Govindan, L., Selvakumari, J., Alkanan, Z. T., Cacciola, F., & Francis, Y. M. (2024). A comprehensive review on anthocyanin-rich foods: Insights into extraction, medicinal potential, and sustainable applications. Journal of Agriculture and Food Research. https://www.sciencedirect.com/science/article/pii/S2666154324002825
Mattioli, R., Francioso, A., Mosca, L., & Silva, P. (2020). Anthocyanins: A Comprehensive Review of Their Chemical Properties and Health Effects on Cardiovascular and Neurodegenerative Diseases. Molecules. https://www.ncbi.nlm.nih.gov/pmc/articles/PMC7504512/
Mayerhöfer, T. G., Pahlow, S., & Popp, J. (2020). The Bouguer‐Beer‐Lambert Law: Shining Light on the Obscure. Chemphyschem : a European journal of chemical physics and physical chemistry. https://pmc.ncbi.nlm.nih.gov/articles/PMC7540309/
Ogata, J., Kanno, Y., Itoh, Y., Tsugawa, H., & Suzuki, M. (2005). Plant biochemistry: anthocyanin biosynthesis in roses. Nature. https://pubmed.ncbi.nlm.nih.gov/15944692/#full-view-affiliation-1
Renoult, J. P., & Valeur, B. (2017). Red Rose Pigments. Chemistry Europe. https://www.chemistryviews.org/details/news/10466233/Red_Rose_Pigments/
Shen, L., Shuixiu Pang, Zhong, M., Sun, Y., Qayum, A., Liu, Y., Rashid, A., Xu, B., Liang, Q., Ma, H., & Ren, X. (2023). A comprehensive review of ultrasonic assisted extraction (UAE) for bioactive components: Principles, advantages, equipment, and combined technologies. Ultrasonics Sonochemistry. https://doi.org/10.1016/j.ultsonch.2023.106646
Tan, J., Han, Y., Han, B., Qi, X., Cai, X., Ge, S., & Xue, H. (2022). Extraction and purification of anthocyanins: A review. Journal of Agriculture and Food Research. https://doi.org/10.1016/j.jafr.2022.100306
Tena, N., & Asuero, A. G. (2022). Up-To-Date Analysis of the Extraction Methods for Anthocyanins: Principles of the Techniques, Optimization, Technical Progress, and Industrial Application. Antioxidants. https://www.mdpi.com/2076-3921/11/2/286
Yokoi, M., & Saitô, N. (1973). Light absorption patterns of intact Rosa flowers in relation to the flower colour. Phytochemistry. https://www.sciencedirect.com/science/article/abs/pii/0031942273804029
Appendix
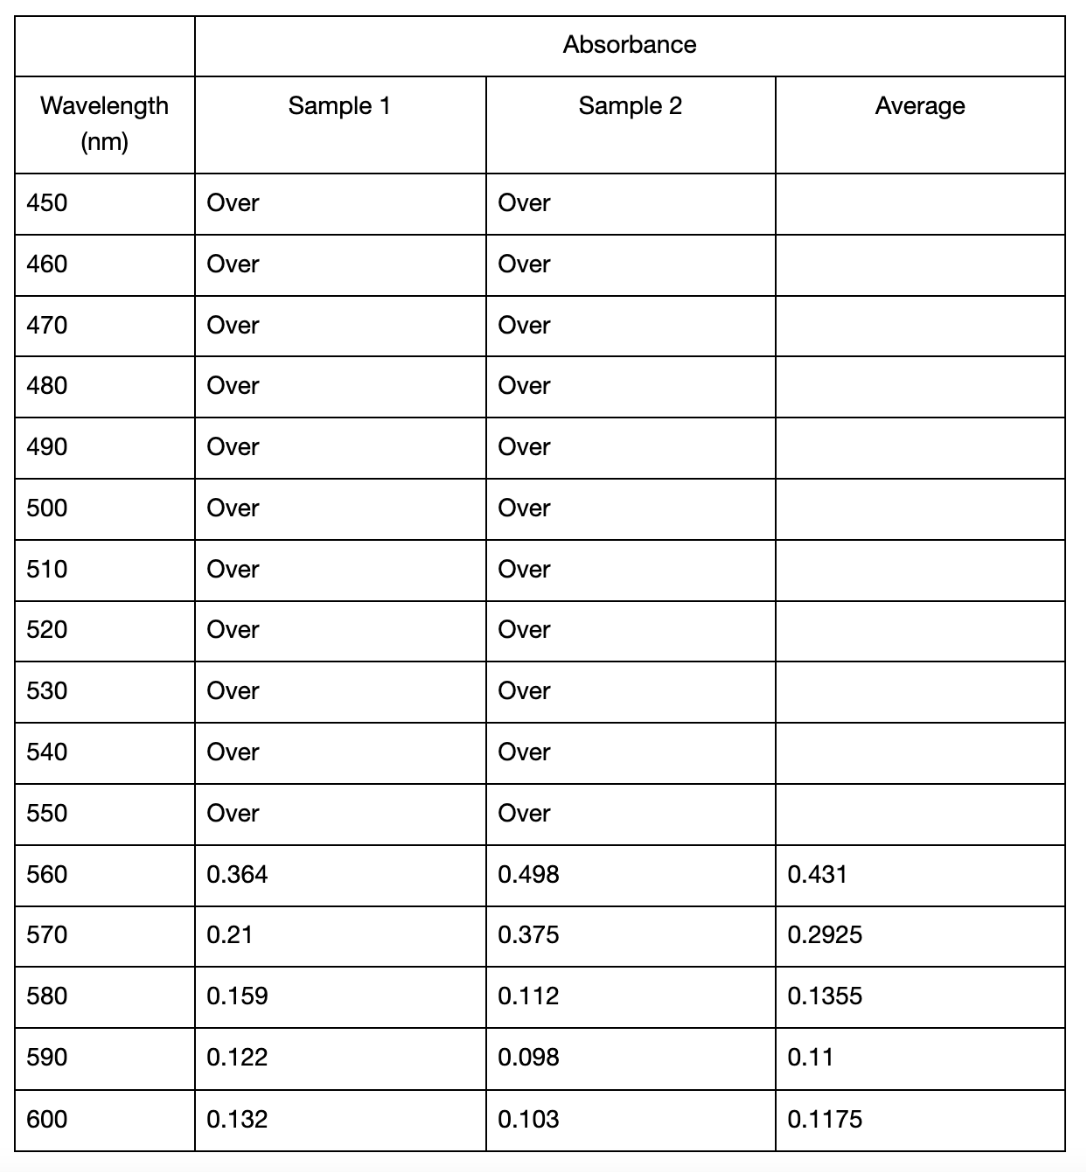
Table 1.1: Absorbance values for extracted pigment using distilled water of pH value 3.15 in Trial 1.
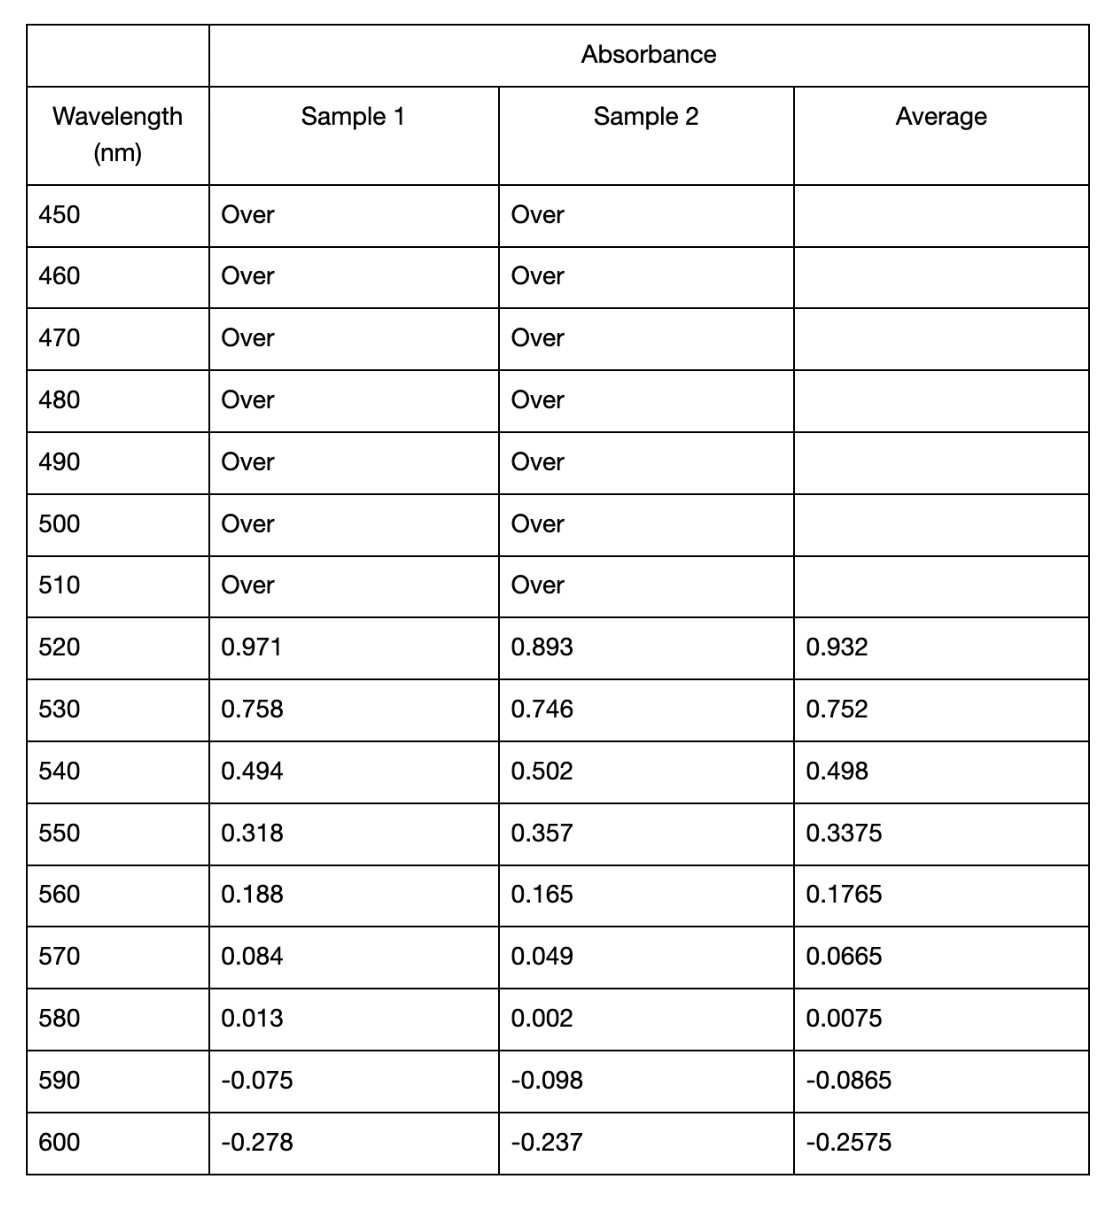
Table 1.2: Absorbance values for extracted pigment using distilled water of pH value 6.34 in Trial 1.
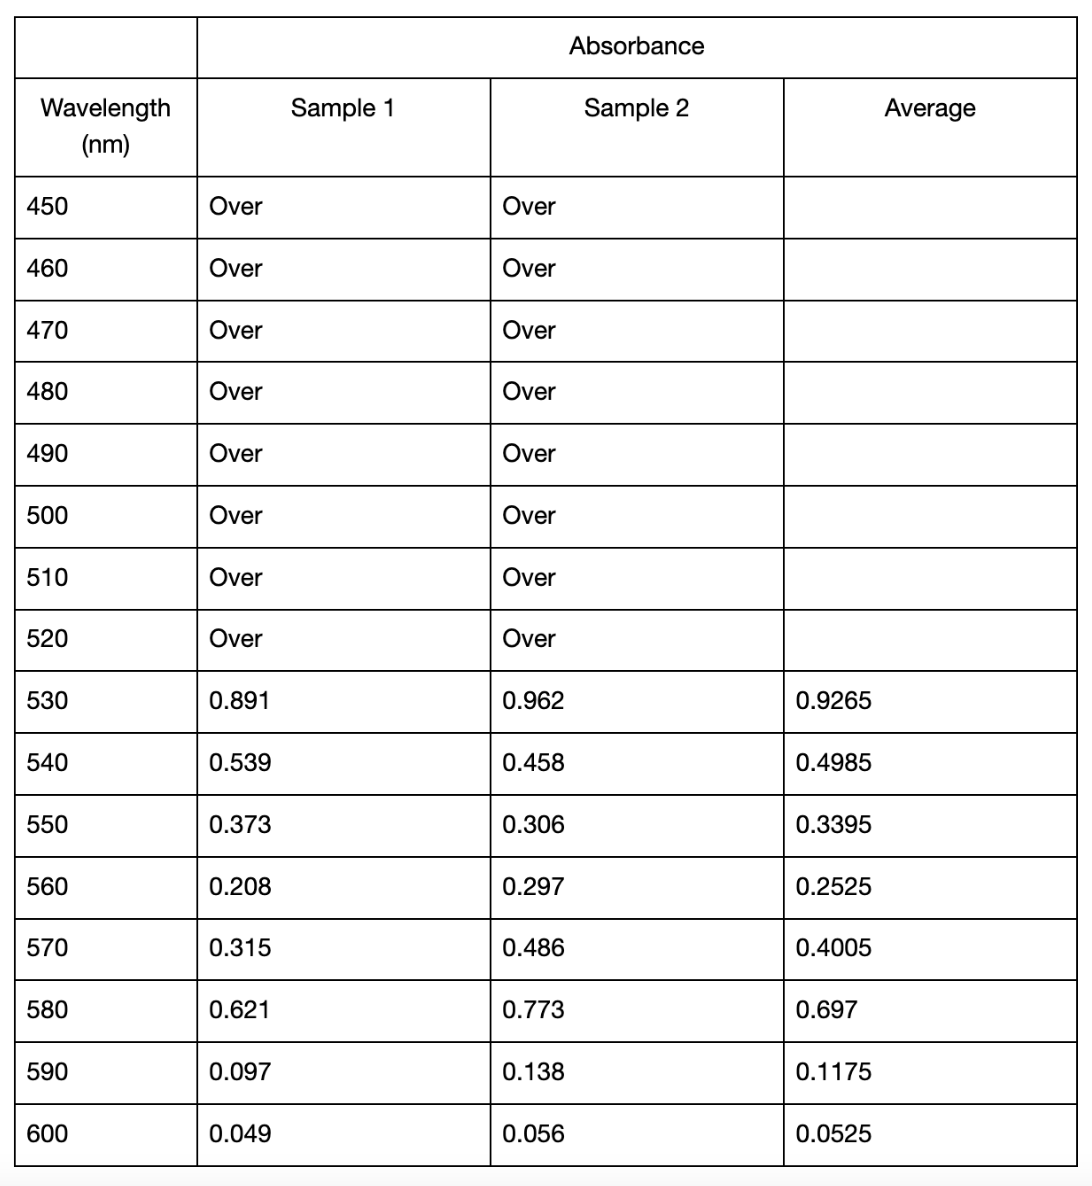
Table 1.3: Absorbance values for extracted pigment using distilled water of pH value 9.27 in Trial 1.
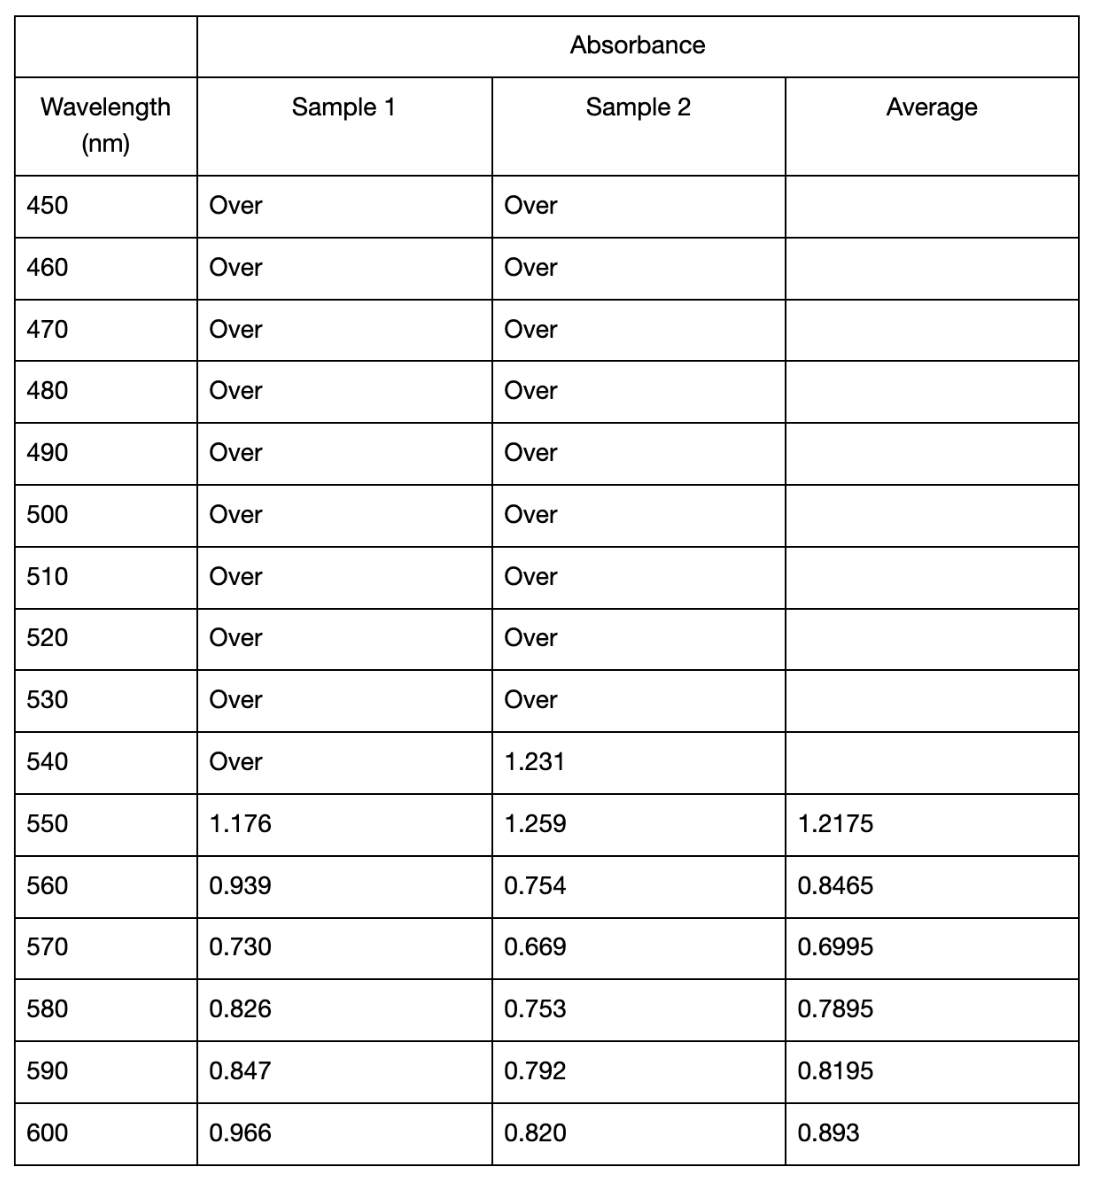
Table 2.1: Absorbance values for extracted pigment using distilled water of pH value 3.21 in Trial 2.
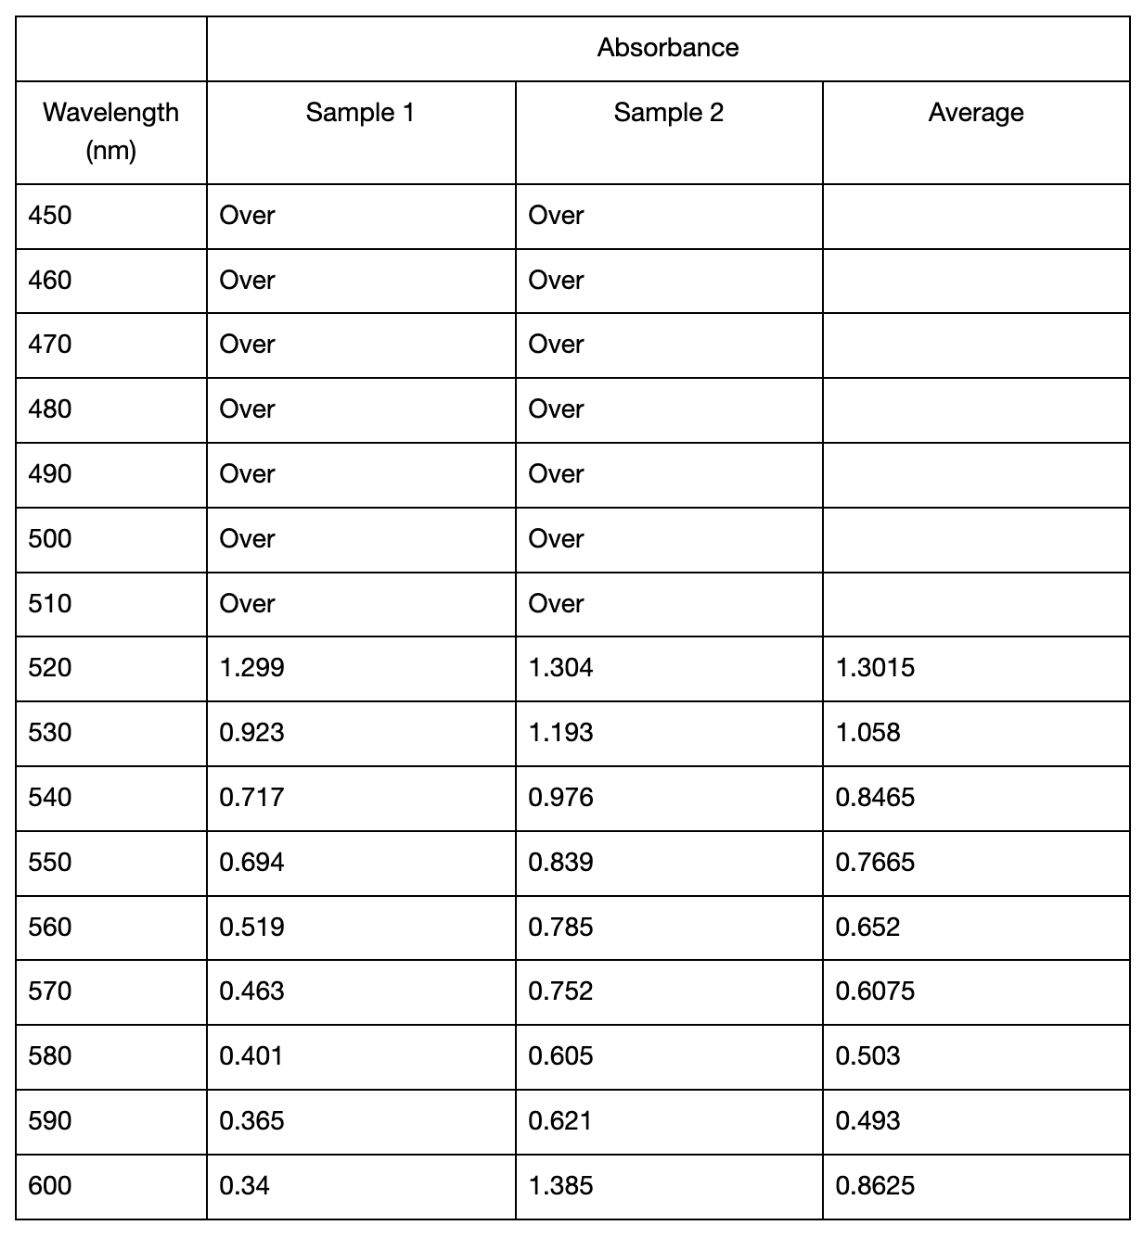
Table 2.2: Absorbance values for extracted pigment using distilled water of pH value 6.09 in Trial 2.
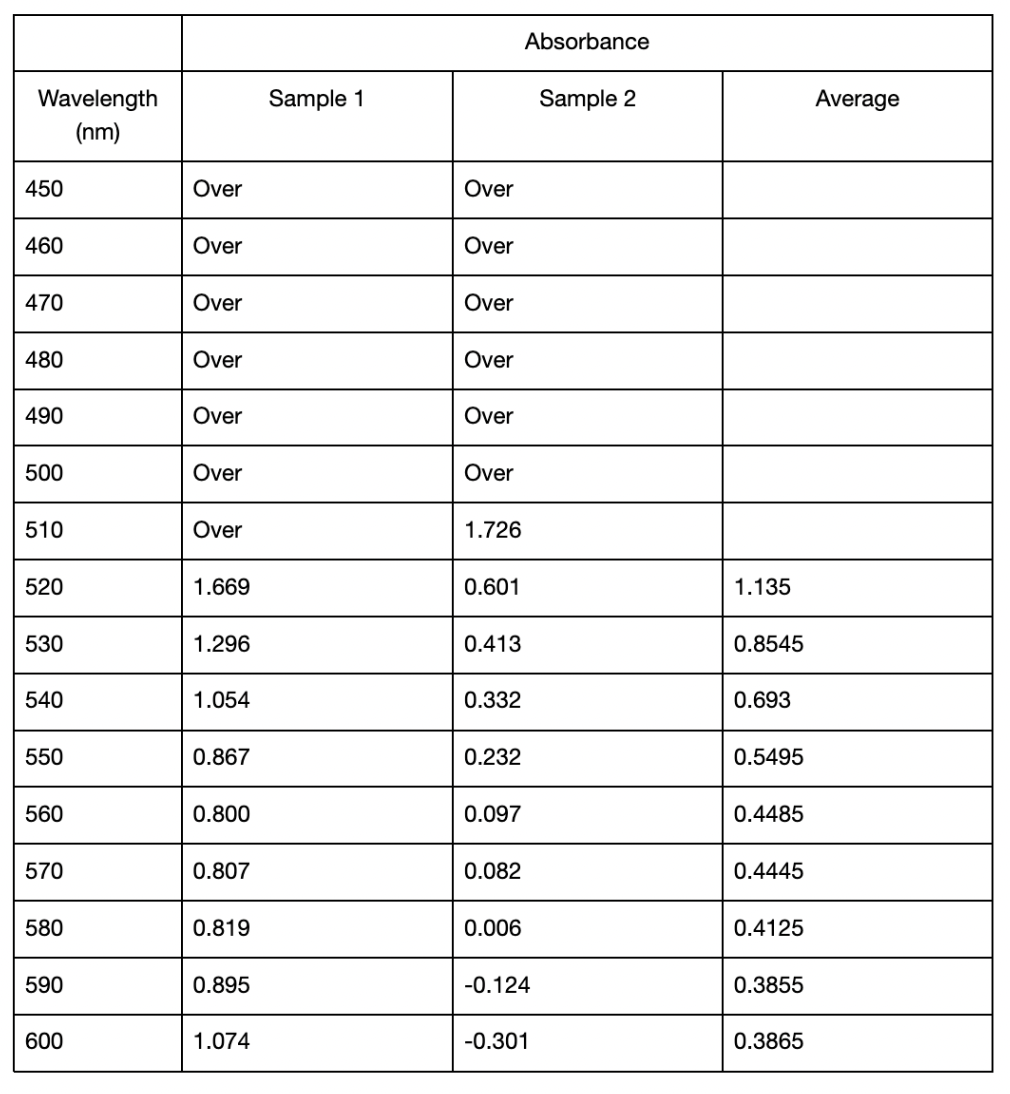
Table 2.3: Absorbance values for extracted pigment using distilled water of pH value 9.17 in Trial 2.