Johnson Song – Applied Science, Year 2
Abstract
Noise pollution in urban environments has become an increasingly pressing health issue, prompting the development of noise-canceling technologies. This project explores the design and testing of an analog circuitry-based selective noise cancellation system intended to preserve human speech frequencies while attenuating unwanted background noise. Using a MAX4466 microphone module with a built-in amplifier and a custom-designed band stop filter composed of second-order low-pass and high-pass filters, the circuit was configured to attenuate frequencies outside the 1000 Hz–4000 Hz range, which is critical for speech intelligibility. Theoretical calculations of voltage gain and transfer functions were compared with experimental data collected using a DS1054Z oscilloscope, where an average percent error of 89% was found. While the system demonstrated the ability to preserve speech-relevant frequencies and reduce ambient noise, it exhibited significant percent error when comparing measured output to theoretical predictions. Despite these limitations, the results support the feasibility of selective noise cancellation through analog circuitry and lay the groundwork for further improvement such as the integration of custom amplifiers and more precise filtering components.
Introduction
Walking in a city, the noises of vehicles, constructions, and human conversations are inevitable. The constant background noise has made peace difficult to find, as a study in 2011 shows that “at least one million healthy life years are lost every year from traffic-related noise in the western part of Europe” (Lin et al., 2011). In order to solve this problem, most people take the approach of wearing headphones that either cancels noises passively or actively.
In nature, noises travel in the form of sound waves through air, with two important characteristics being amplitude and frequency. Amplitude determines the relative strength of sounds, and is commonly known as the loudness or volume of a sound (“Amplitude – Definition, period, frequency and characteristics of sound wave,” 2016). Besides amplitude, frequency represents how many sound wave cycles there are in a given period of time, and it is linked to the pitch of a given sound (“Frequency and Pitch of Sound,” n.d.). To remove those unwanted sounds, the goal of noise cancellation is to reduce the amplitude of the sounds to as low as possible.
The first applicable method is passive noise cancellation, where certain materials have high acoustic impedance, meaning that they can block sounds well by reducing the amplitude of sounds. And in commercial headphones, passive noise cancellation is applied to “seal the ear to prevent leakage” and “reduce high frequency missed by the [active noise cancellation] technology” (Pak, 2024.)
Despite having the advantage of low power cost, passive noise cancellation has its drawbacks of “their big size and inflexibility among small devices.”(Song, 2022) Therefore, active noise cancellation was created to help this. Through analog electronic components, a filter that reduces sounds of different pitches differently can be made. Being one of the most common features of headphones in current days, active noise cancellation enables users to listen to music wherever they want, pick up a phone call in a crowded environment while hearing clearly, and isolate themselves from external sounds.
However, most active noise cancellation headphones are fixed to reduce noises within a certain range of frequencies, causing some wanted sounds to be identified as noise as well. Thus selective noise cancellation is applied. Similar to the basic active noise cancellation, selective noise cancellation could be done digitally through codes that control what sounds to be passed or analogously through a band stop filter which allows sounds within certain ranges to be passed while other ones attenuated. In this paper, a noise cancellation circuit that passes frequencies that are crucial for distinguishing speech and attenuating others will be made.
The main idea behind this project is that sound, which can be expressed by waves, follows the principle of superposition. This means that sound waves can be added up together. For any sound that exists, there is an inverted version of it where every positive value is turned into negative and every negative value is turned into positive. When summing up the sound and its inverse, the result signal has an amplitude of zero, essentially meaning that the sound is cancelled. This effect is shown in Figure 1 where red represents the original signal, blue represents the inverted signal and orange represents the result signal that has an amplitude of zero. The specific design goal for this project is to selectively cancel noises to allow the users to enjoy a noiseless environment without missing any important information such as human speeches that falls in the sound frequency range of 1000 Hz to 4000 Hz, which is the “most important frequency regarding perceived intelligibility [of speech]”(“Facts about speech intelligibility,” n.d.)
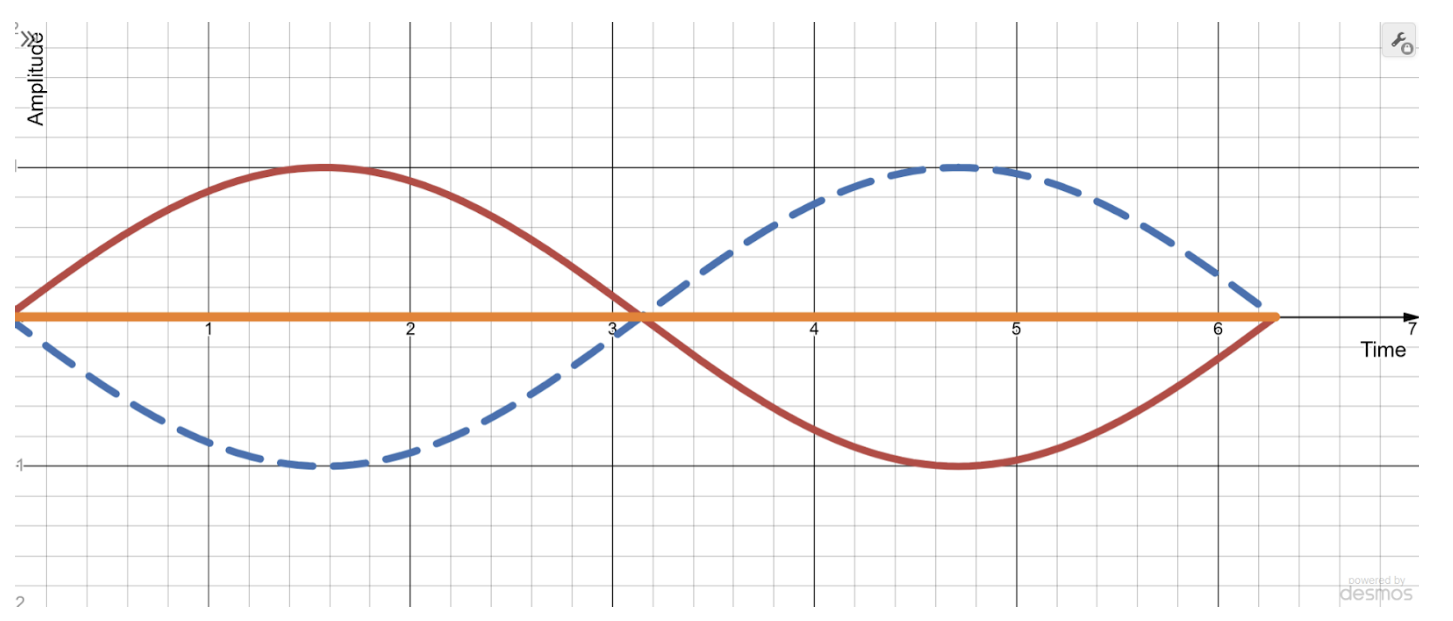
Figure 1. Graph Showing Principle of Superposition
Materials and Methods
There are two main parts to this project: a microphone and amplifier module for the input and a band stop filter that processes the input and delivers the output.
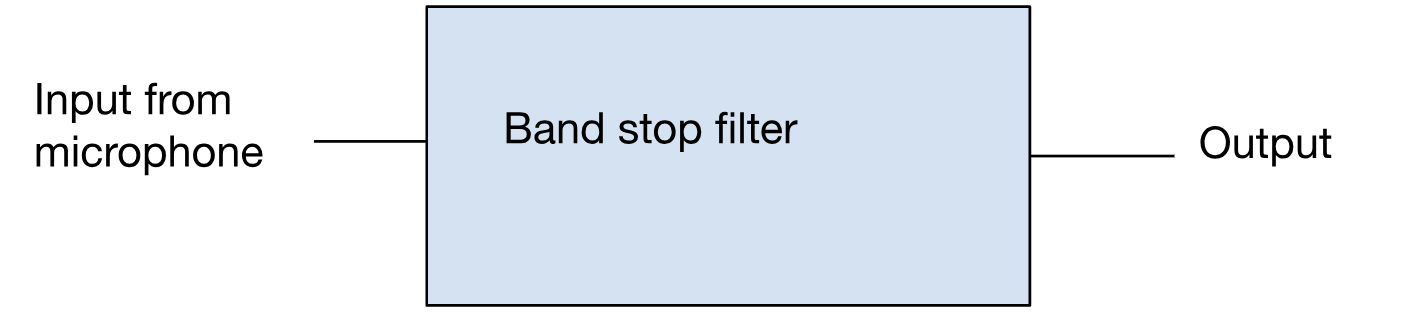
Figure 2. Block Diagram for the Circuit
When the circuit is powered by a 3.3V voltage source from Arduino 3.3V DC output, the MAX 4466 electret microphone starts picking up sound from the environment. The built-in amplifier of the microphone will then amplify the sound signal by 25 times and send this signal to the band stop filter. The band stop filter is constructed of a second order low-pass filter and a second order high pass filter connected in parallel. The second order low pass filter is made from connecting a resistor and capacitor in series across the input signal, and connecting another set of resistor and capacitor where the input is taken from the output of the previous section. In Figure 3 it is represented by R1, R2, C1, and C2. The second order high pass filter is opposite to the low pass filter, where capacitors are connected to resistors in series and repeated, which is R3, R4, C3, and C4 in Figure 3. After the signal is processed by both filters, they are summed up at a point by a parallel connection. This is where the output signal lies. Due to the time constraint, this project does not incorporate any inverting amplifier after the filter; thus data of signal after noise cancellation were collected using “A-B” math function in the DS1054z digital oscilloscope to achieve what an inverting amplifier would have done.
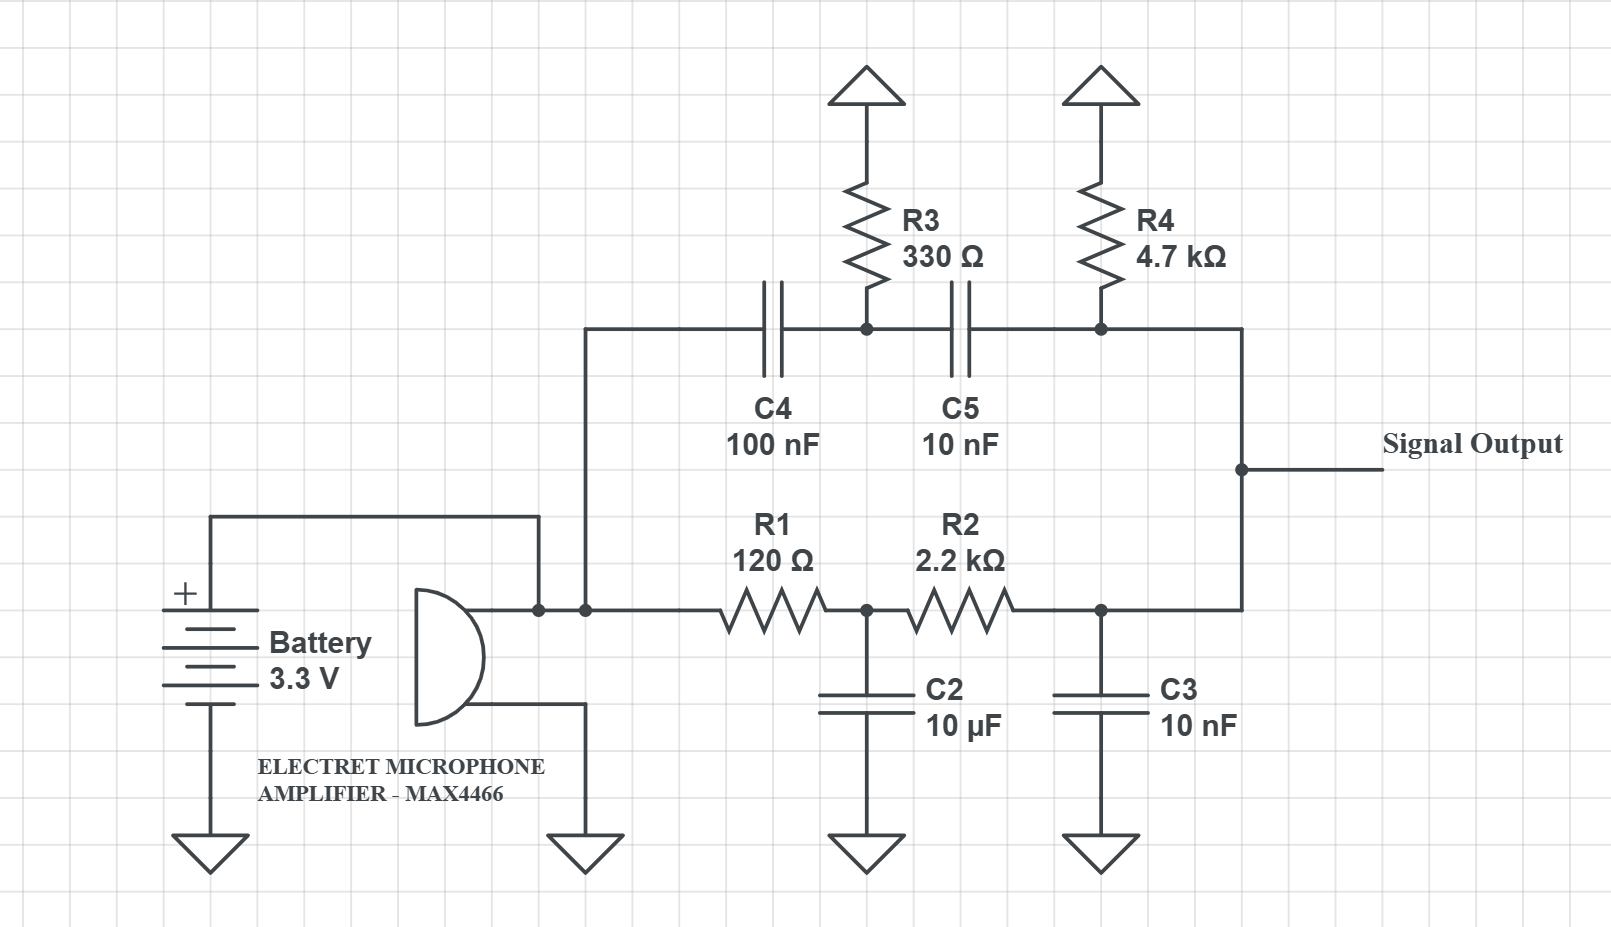
Figure 3. Schematic Diagram of the Circuit
Results
The voltage of the second order low pass filter is:
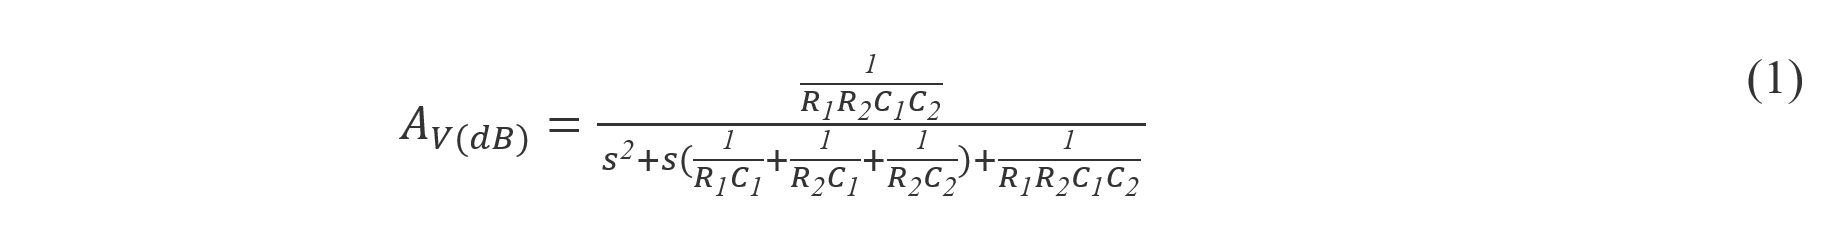
Where voltage gain in decibels is given as:
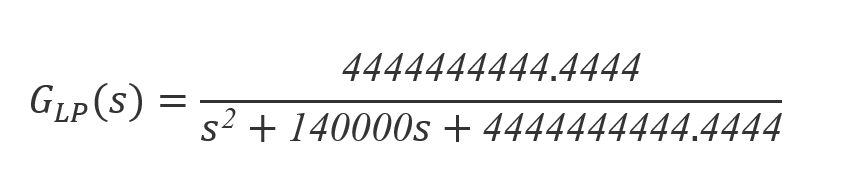
After plugging in values of R1, R2, C1, and C2 from figure 3, equation 1 evaluates to the transfer function:
Where s, the complex frequency is defined as:

In equation 3, σ is the real part in s and is called the neper frequency. This is the variable that affects exponential decay or growth in the amplitude of the system it describes, in this case, the circuit. And jω is the imaginary part that determines the oscillating frequency of a sinusoidal signal which is the frequency of sound input of the circuit. Where ω, the angular frequency, can converted into frequency in Hz according to equation 4:

To visualizing the steady-state behavior of the system, σ is set to be zero; thus s = jω. By substituting this into equation 1 and converting ω into frequency using equation 4, Figure 4, the frequency response of the low pass filter can be obtained.

Figure 4. The Frequency Response of GLP(s). This graph shows the amplitude of signals of varying frequencies after being processed by the low-pass filter.
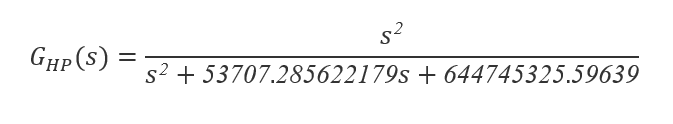
The gain in voltage of the second order high pass filter is given as:

After plugging in values, it evaluates to the transfer function:
By substituting s=jω into equation 4, the bode plot can be constructed:
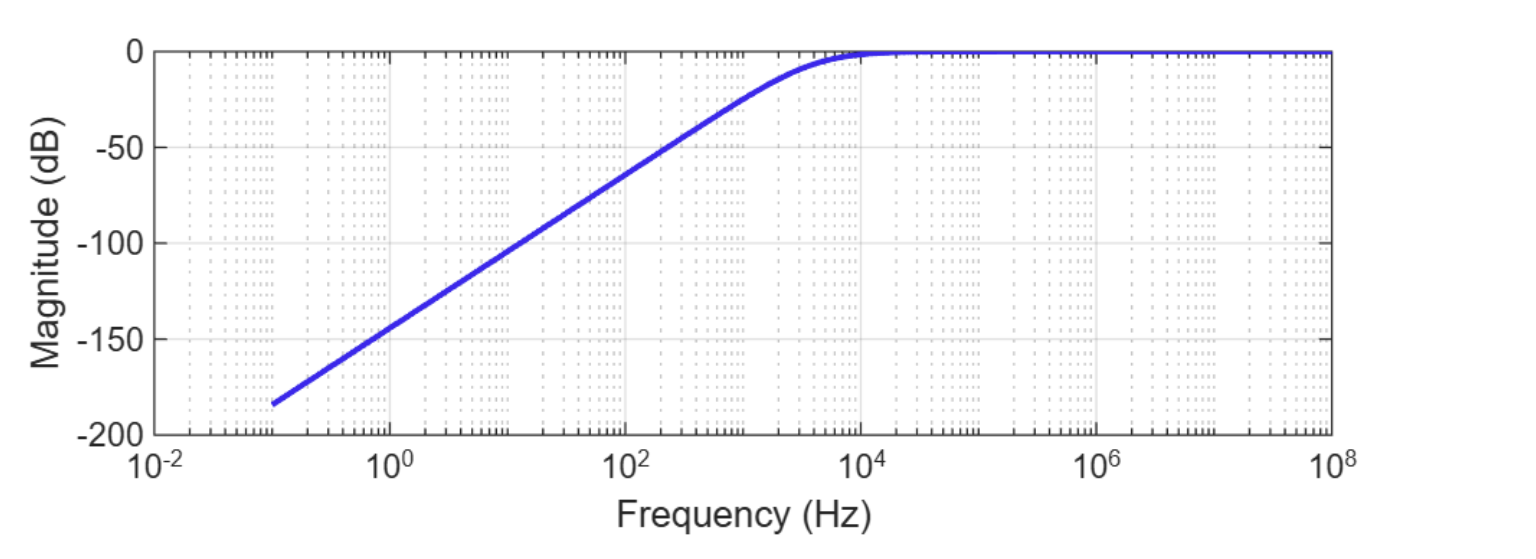
Figure 5. The Frequency Response of GHP(s). This graph shows the amplitude of signals of varying frequencies after being processed by the high-pass filter.
At the end, the output of low pass filter and high pass filter are summed up, and the frequency response is as follows:
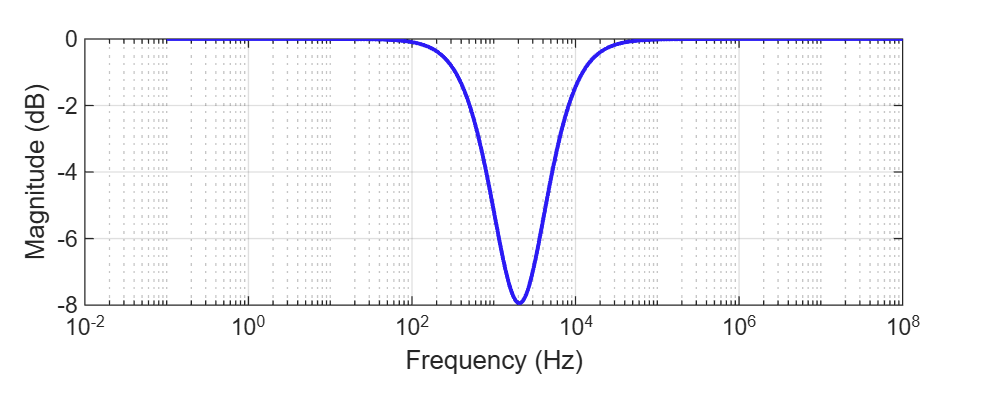
Figure 6. The Frequency Response of Band Stop Filter. This graph shows the amplitude of signals of varying frequencies after being processed by the band-stop filter.
Using Figure 6, the magnitude of voltage gain at certain frequencies can be found. However, the unit of voltage gain (AV) is in decibels, so a unit conversion according to equation 5 will be applied to later calculations to get the voltage in ratio.

At 500 Hz, the voltage gain in decibels is -1.96 dB, which converts to

in ratio.
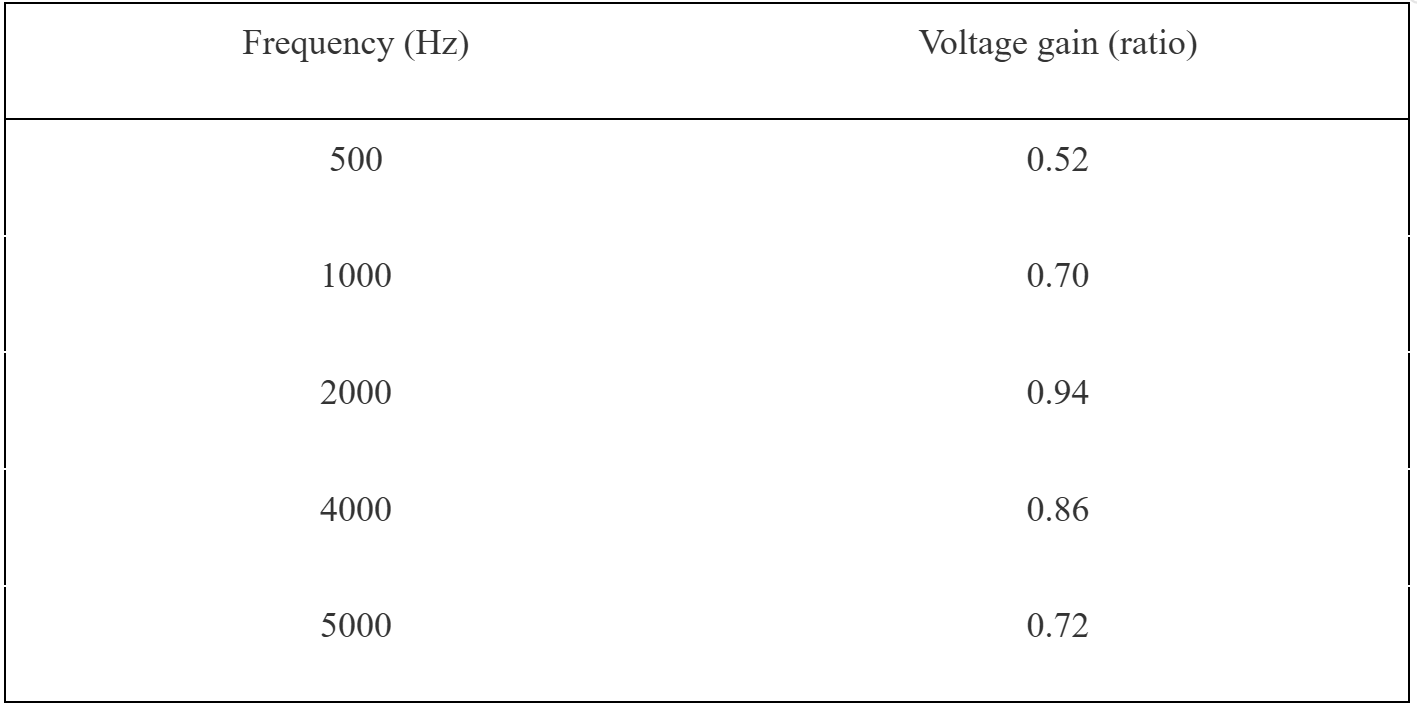
Table 1. Theoretical Voltage Gain of Band Stop Filter at Different Frequencies
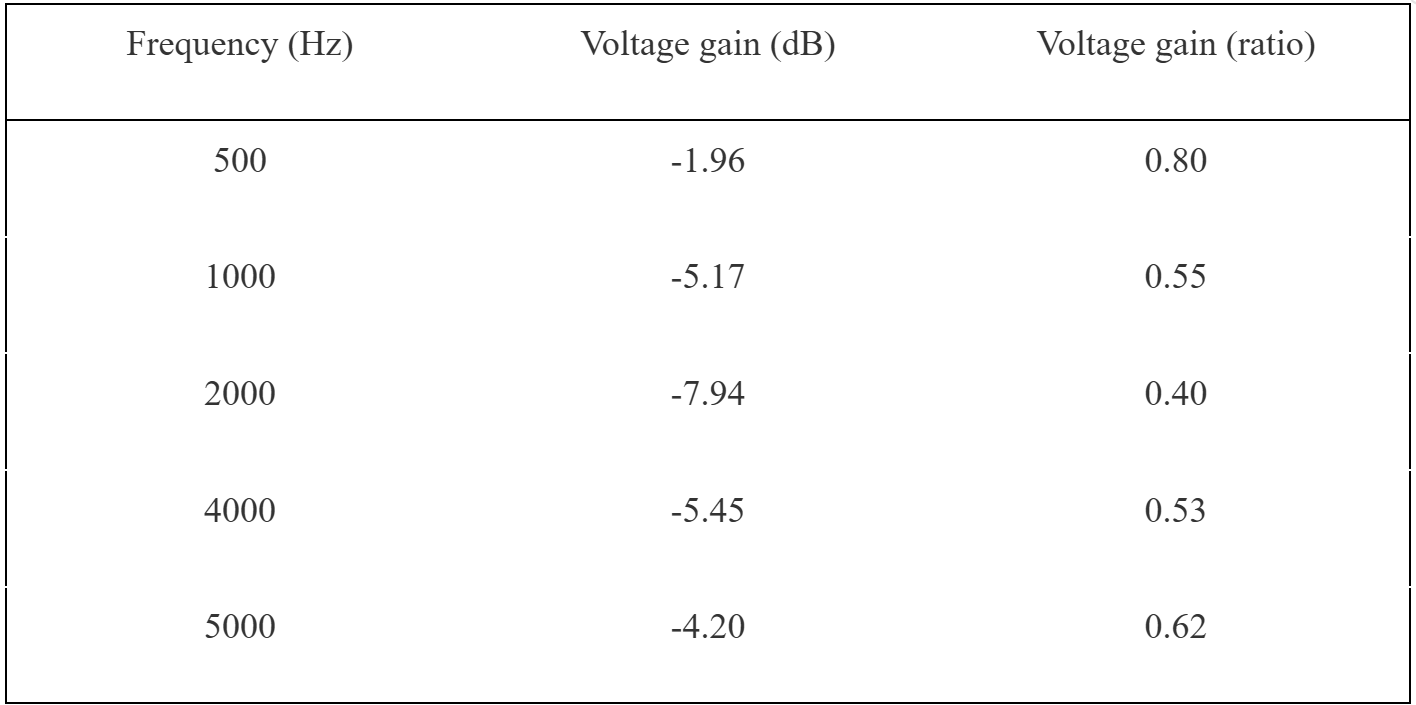
After subtracting the voltage gain in ratio of band stop filter from 1.00, which represents the amplitude of the original signal, the theoretical resultant voltage gain in ratio of cancelled noises at different frequencies could be obtained.
At 500 Hz, the voltage gain in ratio is

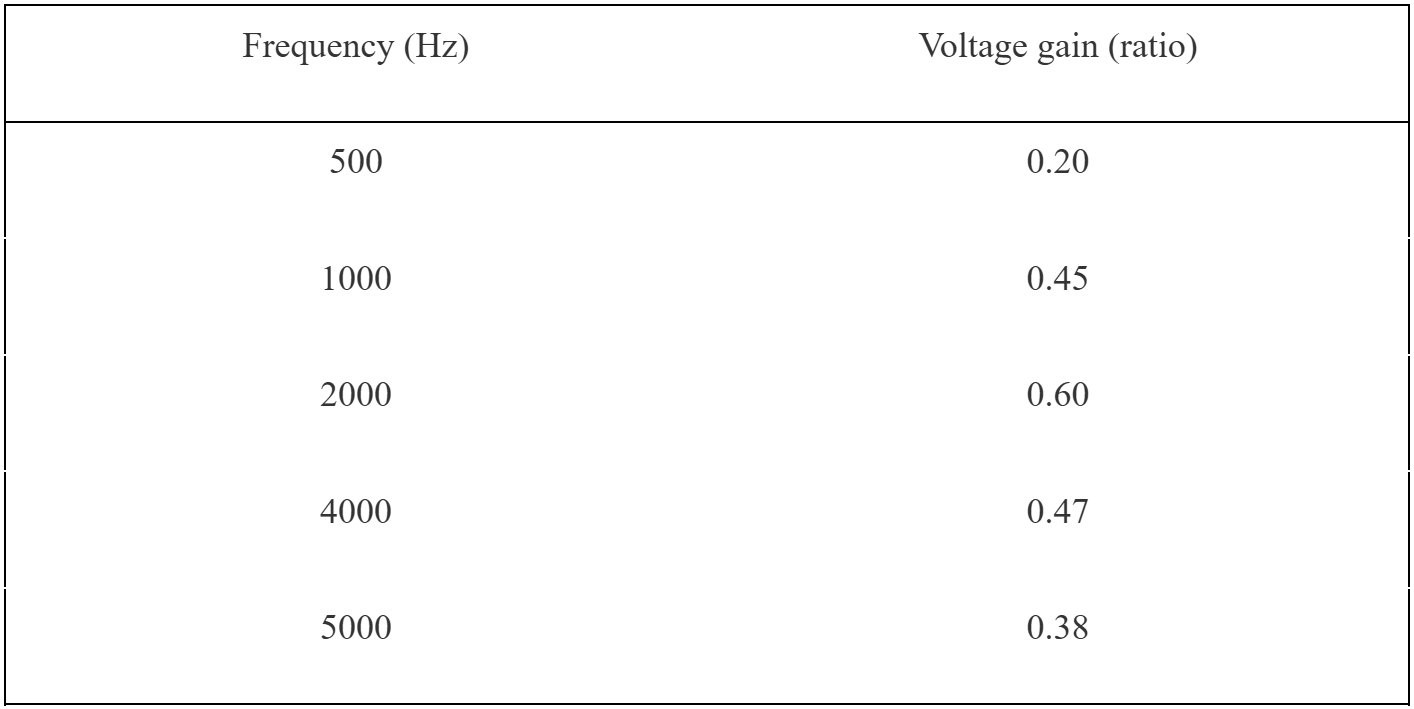
Table 2. Theoretical Resultant Voltage Gain at Different Frequencies
After the theoretical calculation, here are some results of the real circuit. All of the sound inputs starting from figure 4 to figure 13 are played on the same device with the same volume setting, and a RIGOL DS1054Z oscilloscope is used to acquire the data. Due to time constraints, the real cancellation effect is simulated in the oscilloscope using the MATH A-B function.
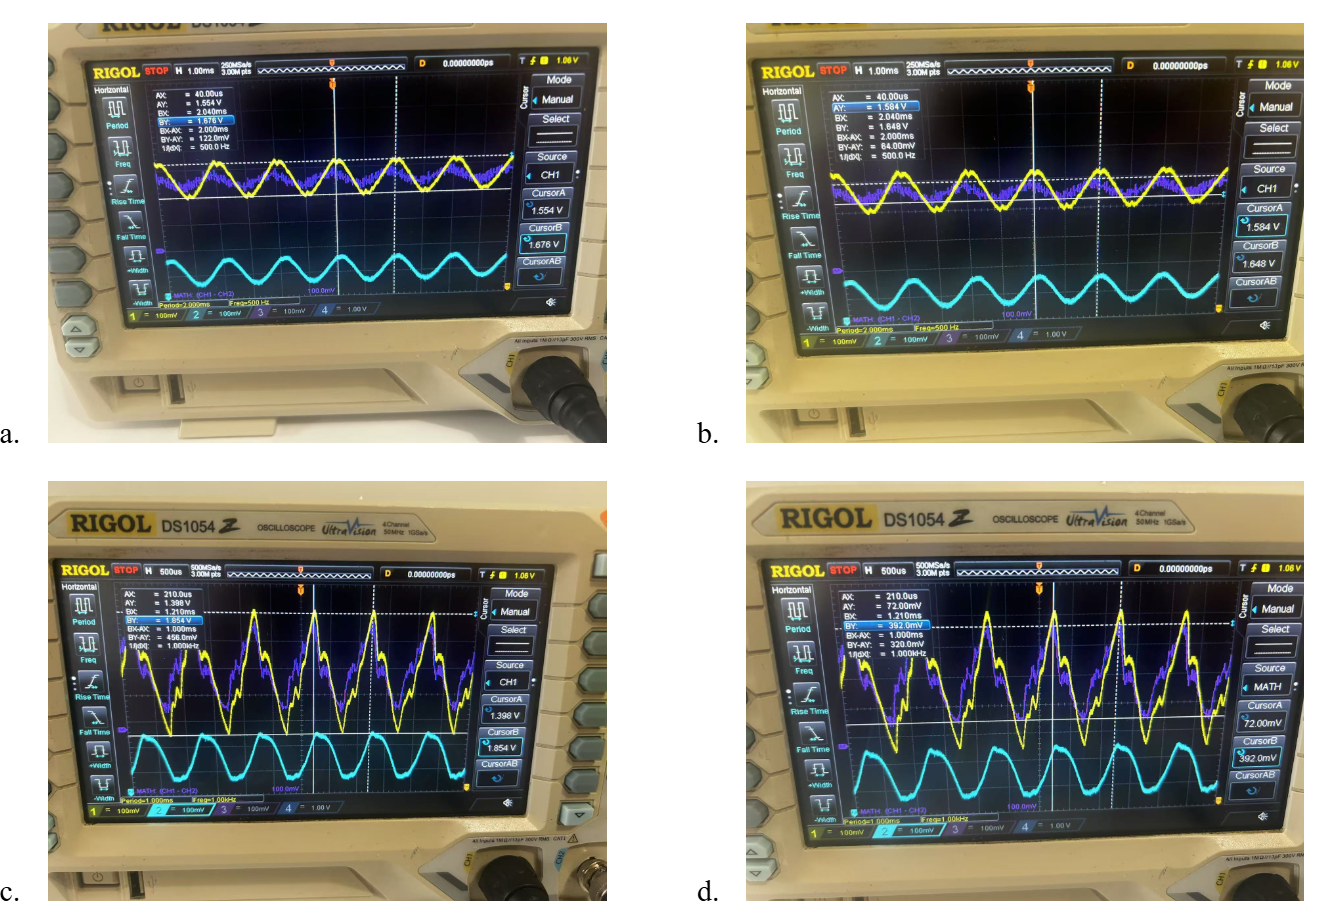
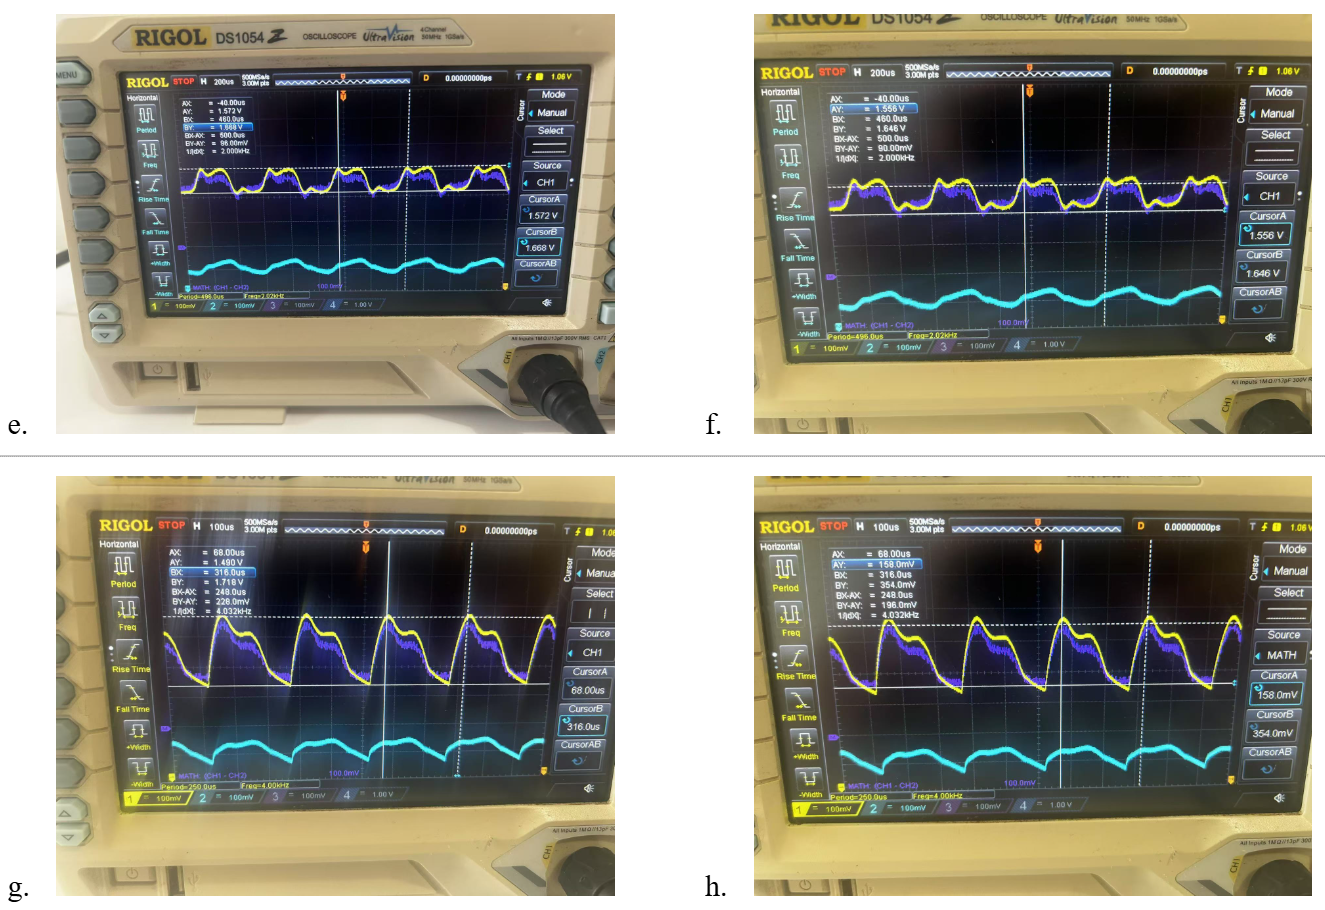
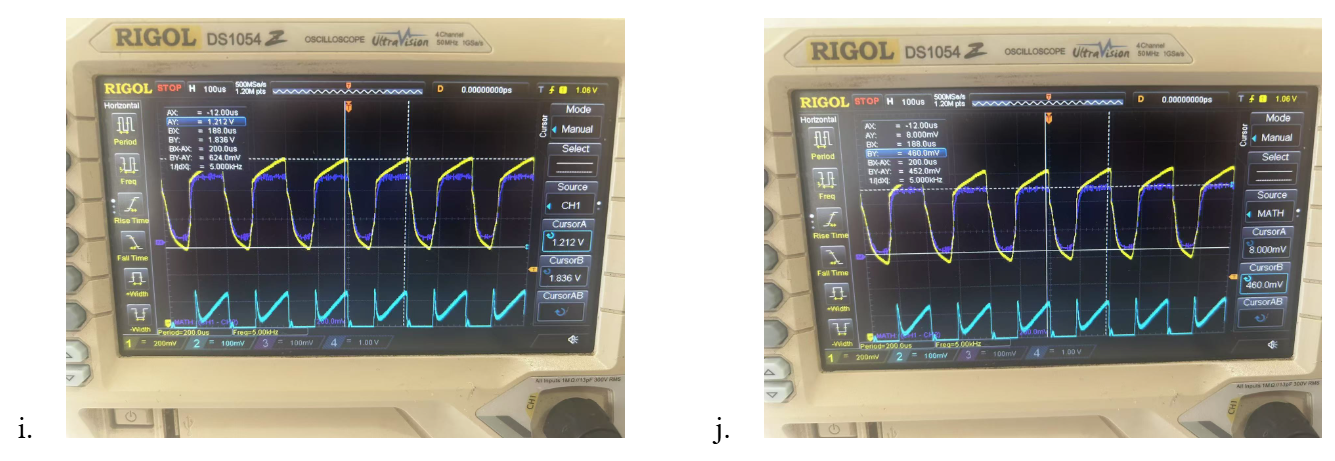
Figure 7: Amplitude of Signals at Different Frequencies. The yellow curve represents signal from the microphone, the blue curve represents the signal processed by the band stop filter, and the purple curve is the output that represents the actual sound that users will hear. (a) The amplitude of the signal from the microphone is 61 mV. (b) The amplitude of output signal is 32 mV. (c) The amplitude of the signal from the microphone is 228 mV. (d) The amplitude of output signal is 160 mV. (e) The amplitude of the signal from the microphone is 48 mV. (f) The amplitude of output signal is 45 mV. (g) The amplitude of the signal from the microphone is 114 mV. (h) The amplitude of output signal is 98 mV. (i) The amplitude of the signal from the microphone is 312 mV. (j) The amplitude of output signal is 226 mV.
Using results from Figure 7, the experimental resultant voltage gain at different frequencies could be calculated. The voltage gain at 500 Hz is:
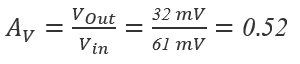
Table 3: Experimental Resultant Voltage Gain at Different Frequencies
Comparing the results from theoretical and actual data using table 2 and table 3, the percent error could be calculated.
Using equation 7, percent error at 500 Hz is:
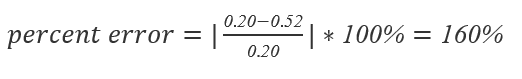
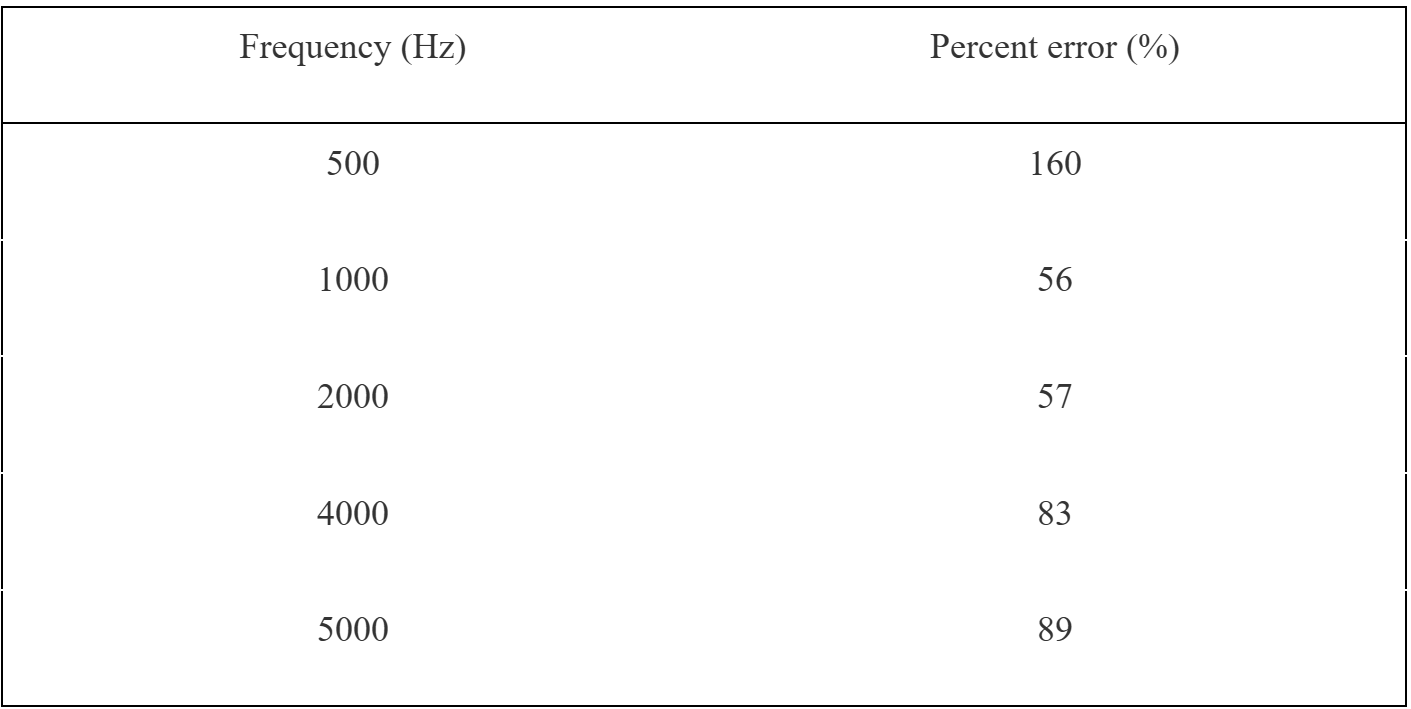
Table 4. Percent Error of the Circuit at Different Frequencies
Discussion
At the first stage of this circuit, noises from the environment are picked up by the MAX4466 electret microphone. The noise signals are then fed to the built-in preamplifier and amplified to a level that can be processed by the filters in the next stage. It could be seen from Figure 7 that the amplitude of the microphone signal changes constantly despite the sound being kept at the same volume. This difference could come from different volumes in the test tone being played since the videos could have different amplitudes of sounds to begin with.
Data from Table 3 reveals that users will feel little effects of noise cancellation, preserving as much details to speech as possible. And frequencies below or above this range will be attenuated more, providing the users with better noise cancellation. This shows that the circuit could indeed work as a selective noise cancellation system that preserves human dialogue as much as possible and cancels other sounds. However, equations Table 4 suggest that the actual measurements deviate from the theoretical significantly, having percent error ranging from 56% to 160%. By comparing the measured voltage gain to the theoretical voltage gain from Table 2 and Table 3, it shows that the actual system keeps the sounds within the range that is crucial to intelligibility of speech at a higher magnitude at the cost of less attenuation of ranges where noise lies. This error could come from tolerance of components, temperature effects, or parasite capacitance from the breadboard, all of which change the actual values from the theoretical calculation.
Some areas of future study include studying what exactly causes the huge percent error, how to make one microphone preamplifier instead of buying a pre-made one, and how a power amplifier can be added to use the output from the filter to power a real microphone in headphones.
References
Amplitude – Definition, period, frequency and characteristics of sound wave. (2016, August 5). BYJUS. https://byjus.com/physics/amplitude-frequency-period-sound/
Facts about speech intelligibility. (n.d.). Pro-audio microphones – DPA Microphones. https://www.dpamicrophones.com/mic-university/background-knowledge/facts-about-speech-intelligibility/
Frequency and Pitch of Sound. (n.d.). https://phys.libretexts.org/Courses/Coalinga_College/Physical_Science_for_Educators_(CID%3A_PHYS_14)/14%3A_Property_of_Sound_Doppler_Effect_and_Interferences/14.06%3A_Frequency_and_Pitch_of_Sound#:~:text=Summary-,How%20high%20or%20low%20a%20sound%20seems%20to%20a%20listener,waves%0produce%20low%2Dpitched%20sounds.
Lin, F., Lex, B., Rokho, K., Dietrich, S., & Stelios, K. (2011, July 7). Burden of disease from environmental noise – Quantification of healthy life years lost in Europe. World Health Organization (WHO). https://www.who.int/publications/i/item/burden-of-disease-from-environmental-noise-quantification-of-healthy-life-years-lost-in-europe
Pak, R. (2024, April 2). Engineering healthy silence: Using noise-cancelling headphones to block harmful sound. Illumin – USC Viterbi School of Engineering. https://illumin.usc.edu/engineering-healthy-silence-using-noise-cancelling-headphones-to-block-harmful-sound/
Song, Y. (2022). Active noise cancellation and its applications. Journal of Physics: Conference Series. 2386 https://doi.org/10.1088/1742-6596/2386/1/012042