Rachel Ronque – Life Science, Year 2
Abstract
During the COVID-19 pandemic, more people began to grow and preserve their own produce via pickling. At-home pickling can preserve produce for up to a month due to the vinegar brine’s acidic pH level and ability to inhibit bacterial growth. Because do-it-yourself pickles have a much shorter lifespan compared to commercialized pickles, this leads to questions of quality. In this study, white, apple cider, malt, and balsamic pickling brines had their pH recorded for up to five weeks and bacterial growth visualized on Petri dishes via spread plating to investigate bacterial growth and pH over time in homemade pickles. The results assumed that lactic acid bacteria, specifically Lactobacillus, had dominance in every sample, with fluctuations in surface area growth per week. While the results differed between the two trials, they did provide an insight into microbial growth in pickles prepared with different vinegar brines.
Introduction
As humans adapted to an agricultural lifestyle across the globe, pickling food slowly engrained itself as an integral part of many cultures. Believed to begin in ancient Mesopotamia in 2400 BC, food preservation by brining, vinegar, or any similar solution spread globally (Pruitt, 2015). Throughout the COVID-19 pandemic, there have been increasing trends of people growing fruits and vegetables in their gardens to eat, setting a portion of their produce to be pickled for later consumption (Niles, 2021). In addition to helping people save money on produce in today’s economy, pickles are a great source of vitamins, antioxidants, and help replenish electrolytes (Nelson, 2023). Today, the do-it-yourself production and consumption of pickles lead to questions of quality; is there a preferred safe acidity level in order for the pickles to not spoil? To ensure both safety and quality, understanding the bacteria involved in the fermentation process and learning to maintain proper acidity levels are essential for at-home pickling methods to prevent spoilage.
According to Sawada et al. (2021b), safe pickle production occurs in anaerobic conditions with a low pH level. Testing on samples from eight different pickle manufacturers in Japan, including raw materials, pickles, and used brine, they theorized the pretreatment and preparation of initial materials could change the microbiota in completed pickle products. The pickles studied: sauerkraut, cucumber, and kimchi, among others, helped ferment through lactic acid bacteria (LAB). LABs are microorganisms frequently present in fermentation of various foods, and were identified as Lactobacillus and Leuconostoc through culture dependent and independent methods. With further cultivation, microbiota change was determined by lactic acid fermentation conditions and LAB composition. During stock prep, pH level of the brine was measured for comparison with the finished pickling solution’s product. Based on the results, pH became less acidic over time.
During pickling, LAB produces lactic acid in sealed, anaerobic environments to lower the pH. The lower pH allows less harmful bacteria to grow and enables LAB to thrive (Sawada et al., 2021b). Another study by Sawada et al. (2021a) focused on different methods to dehydrate vegetables to make nukazuke (Japanese rice bran pickles) while testing the variable of drastic temperature change. One batch was dehydrated via smoking and pickled with temperatures ranging from -2C to 1C (winter pickles). The other batch was sun dried and pickled with a temperature range of 6C to 27C (summer pickles). The drastic difference of pickling conditions resulted in a big difference of microbiota. The study concluded with an unclear relationship between lactic acid production and bacteria due to the winter pickles having a smaller amount of LAB, but suggested that other bacteria must be investigated to determine a more complete pickling process.
Ozer & Yıldırım (2019) approached studying pickles in a different way compared to the papers above, comparing the vitamin content in many fermented cabbage products. In addition, the paper reinforced the presence of LAB in many pickled foods, while also introducing variables of vegetable freshness, salt concentration, time and temperature, and the growth of the microbial population during fermentation. Their study used vinegar brine concentration chosen for LAB growth through lactic acid fermentation and measured pH during their experimental period. The results found an increase in pH directly related to the salt content. While all of their samples showed an increase in pH, the jars with lower salt content had a faster rise of pH compared to higher salt content samples. It could be inferred that the salt present in fermentation prevented more lactic acid production. This in turn prevented the LAB from altering the pH. Despite the addition of salt, the study emphasized the importance of vinegar brine being a vital part of maintaining a safe pH level to create edible pickles.
The research mentioned above tackled broader questions of safety, quality, and bacterial growth. All papers stressed the importance of LAB being a key piece in making of pickles, specifying Lactobacillus and Leuconostoc as the most common bacteria present. Ozer & Yıldırım (2019), as well as Sawada et al. (2021b) also investigated the influence of pH on pickles, noting the contents of the pickling solution usually reached similar pH levels when fermenting for a longer period of time. While general information is available about the types of bacteria present during pickling, as well as an overview of how pH changes over time, our understanding of the relationship between bacterial growth and different types of vinegar brines for at home pickles could be further expanded. The proposed methodology will measure both the bacteria growth via Petri dishes and pH levels of pickled carrots and cucumbers to contextualize the relationship between the two variables. Pickled vegetables will be swabbed weekly to visually compare the microbial growth of pickles prepared using apple cider, white, balsamic and malt vinegars respectively.
By investigating the relationship between varying pH levels and bacterial growth , this study will provide insights on microbiological profile on the do-it-yourself home pickling process. Understanding this relationship will help improve pickling techniques and enhance food safety in homemade pickles.
Materials and Methods
The experiment was conducted over ten weeks and consisted of two trials. During the first week, the pickles were prepared. The four jars were first labeled according to their pickling solutions: white vinegar, apple cider vinegar, malt vinegar, and balsamic vinegar. The two cucumbers and four carrots were washed with water and patted dry. The cucumbers were then cut in half horizontally, while the carrots were peeled, with the discarded peels placed in the organic scraps container. One whole carrot and one cucumber half were julienned and placed into the jar labeled for white vinegar. This process was repeated until all four carrots and cucumber halves had been used, ensuring that each was placed in its corresponding labeled jar.
Next, the brine solutions were prepared. A total of 200ml of white vinegar and 200ml of water were measured, and the initial pH of the vinegar was recorded using the pH meter (VIVOSUN). The white vinegar and water mixture was then poured into a 400ml beaker and heated to boil on a hot plate. Once boiling, the hot solution was poured into the jar labeled for white vinegar using heat-resistant gloves. The lid was securely fastened to begin the pickling process. This procedure was repeated for the remaining vinegar solutions until all four jars were filled and sealed. The jars were then left to cool to room temperature before being placed in a refrigerator.
Data was collected after one week. Personal protective equipment (lab coat, gloves, goggles) was worn before handling any samples. A saline solution was prepared by dissolving 0.9g of salt into 100ml of water in a 100ml beaker. The salt was measured using a scale and stirred until fully dissolved. A total of 180μl of the saline solution was then pipetted into four microcentrifuge tubes. Agar was prepared and set into petri dishes, which were labeled with the date and solution name.
The pickle jars were then opened, and approximately 10ml of each brine solution was poured into four separate beakers, each labeled with the corresponding vinegar type. The pH of each solution was measured using the pH meter, with the probe rinsed with water and dried between measurements. One carrot pickle and one cucumber pickle were then removed from each jar using tweezers and placed in their respective brines. A sterilized cotton-tipped applicator was used to collect bacteria from each pickle before mixing it into the appropriately labeled microcentrifuge tubes. This process was repeated until all bacterial samples had been collected. The microcentrifuge tubes were gently flicked and/or vortexed to mix their contents.
A candle was lit to provide a sterile working environment. Using a micropipette, 160μl of bacterial suspension was transferred onto the appropriately labeled Petri dishes. An L-spreader was used to evenly distribute the solution, and the Petri dishes were flipped upside down upon completion. This process was repeated for all samples before the Petri dishes were placed in an incubator for seven days. The remaining pickles were returned to refrigeration.
This procedure was repeated weekly until the pickles reached four weeks of age. In lieu of completing colony forming units, the Petri dishes were categorized into “high”, “medium” and “low groups” based on bacterial covering of the plates. Once the pickles were four weeks old, they were discarded. The entire experiment was then repeated for the second trial.
Results
pH
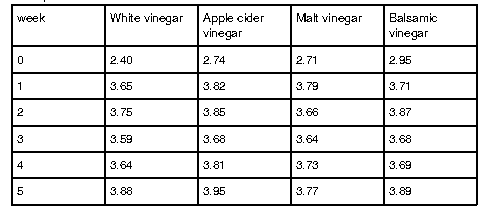
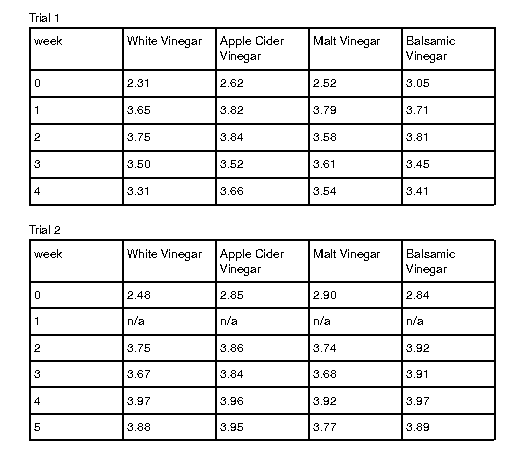
Table 1 illustrates the change of the pH level over time. From preparation to the first week for both trials, all brine solutions’ pH level increased by more than 0.5 and became less acidic. The majority of the brines all stayed within the pH range of 3.0-4.0 throughout the experimental period. Only the initial measurement of pH level in the brines was below the aforementioned range. The majority of pH levels peaked during the second and third week before fluctuating for the following two weeks of fermentation. White vinegar started with a minimum pH of 2.40 and peaked at 3.88 in week five. Apple cider vinegar ranged from 2.74 to a high of 3.95, also in week five. Malt vinegar had its lowest pH at 2.71 and reached its highest, 3.79, in week one. Balsamic vinegar varied between 2.95 and 3.89, with its peak occurring in week five.
Table 1: Mean pH levels across two trials for pickles prepared with white, apple cider, malt and balsamic vinegar
Bacterial growth
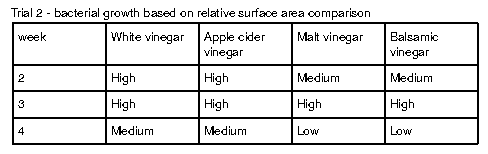
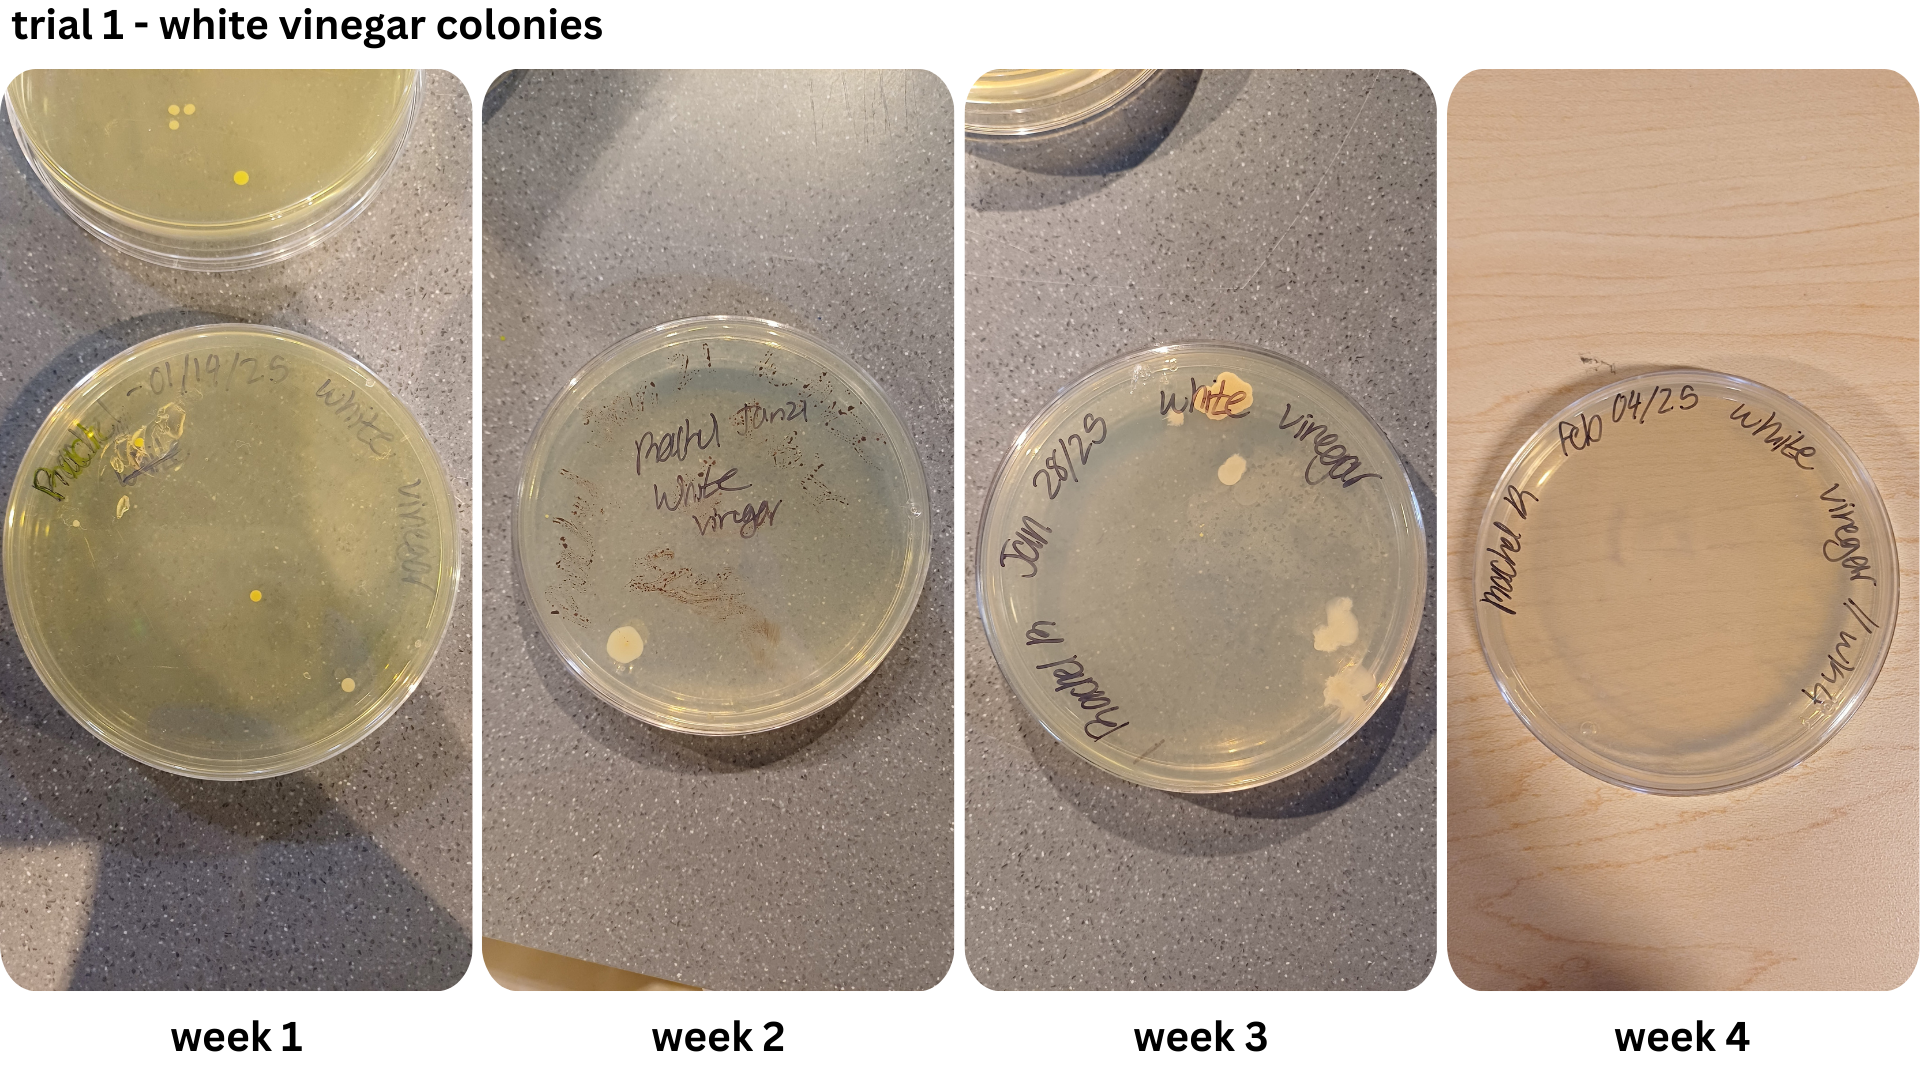
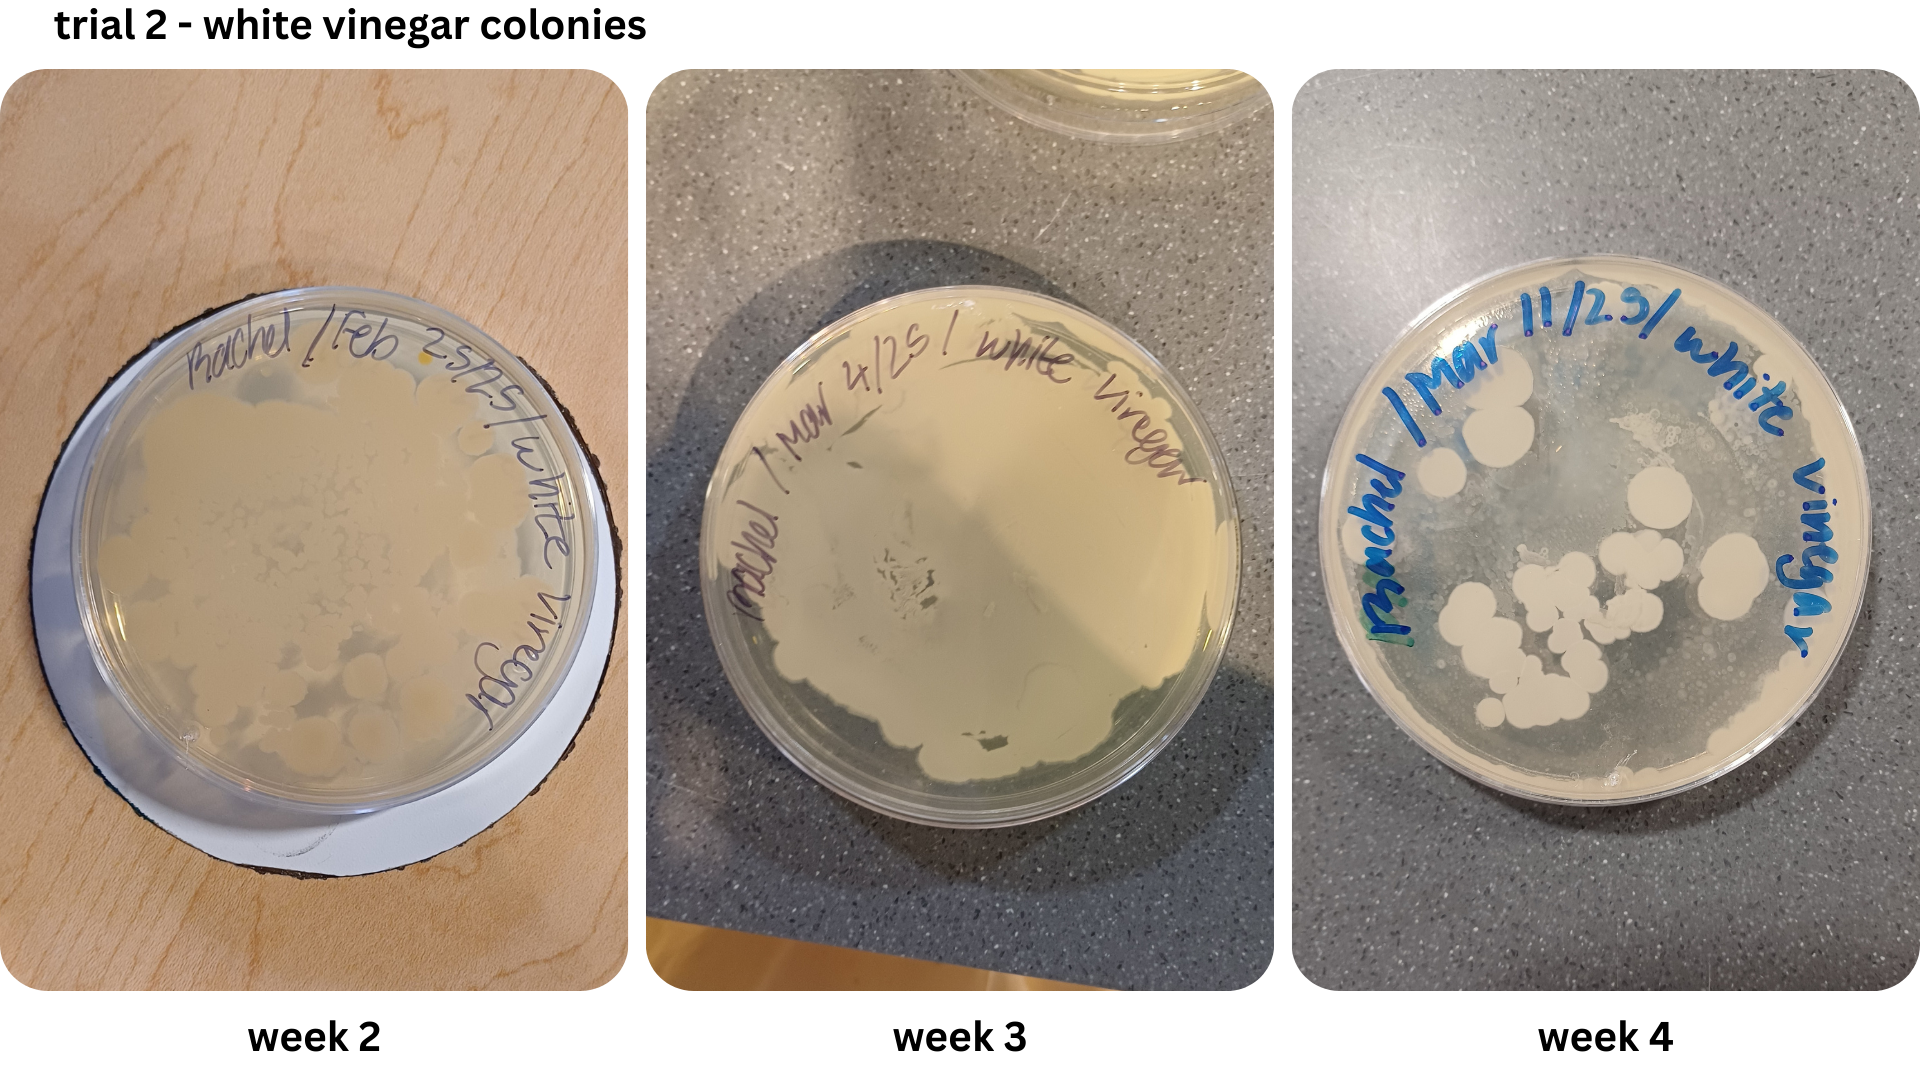
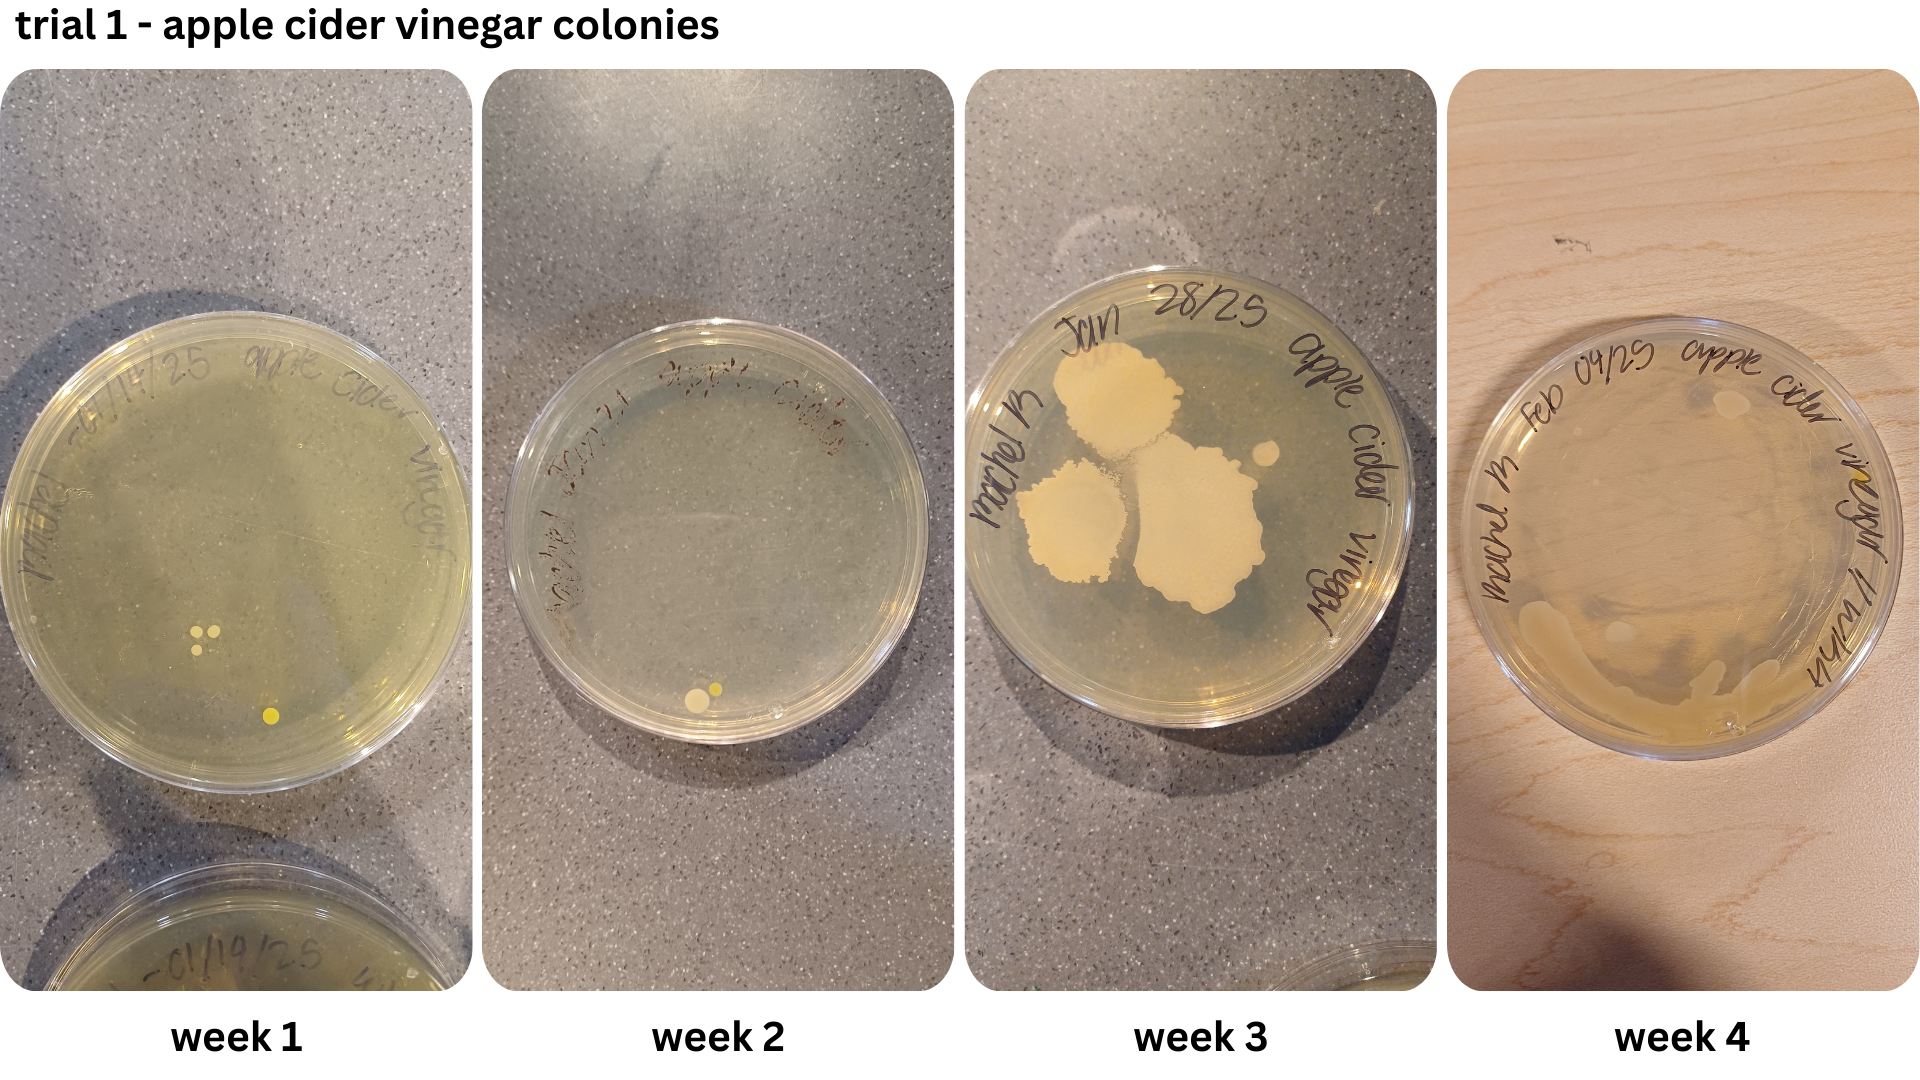
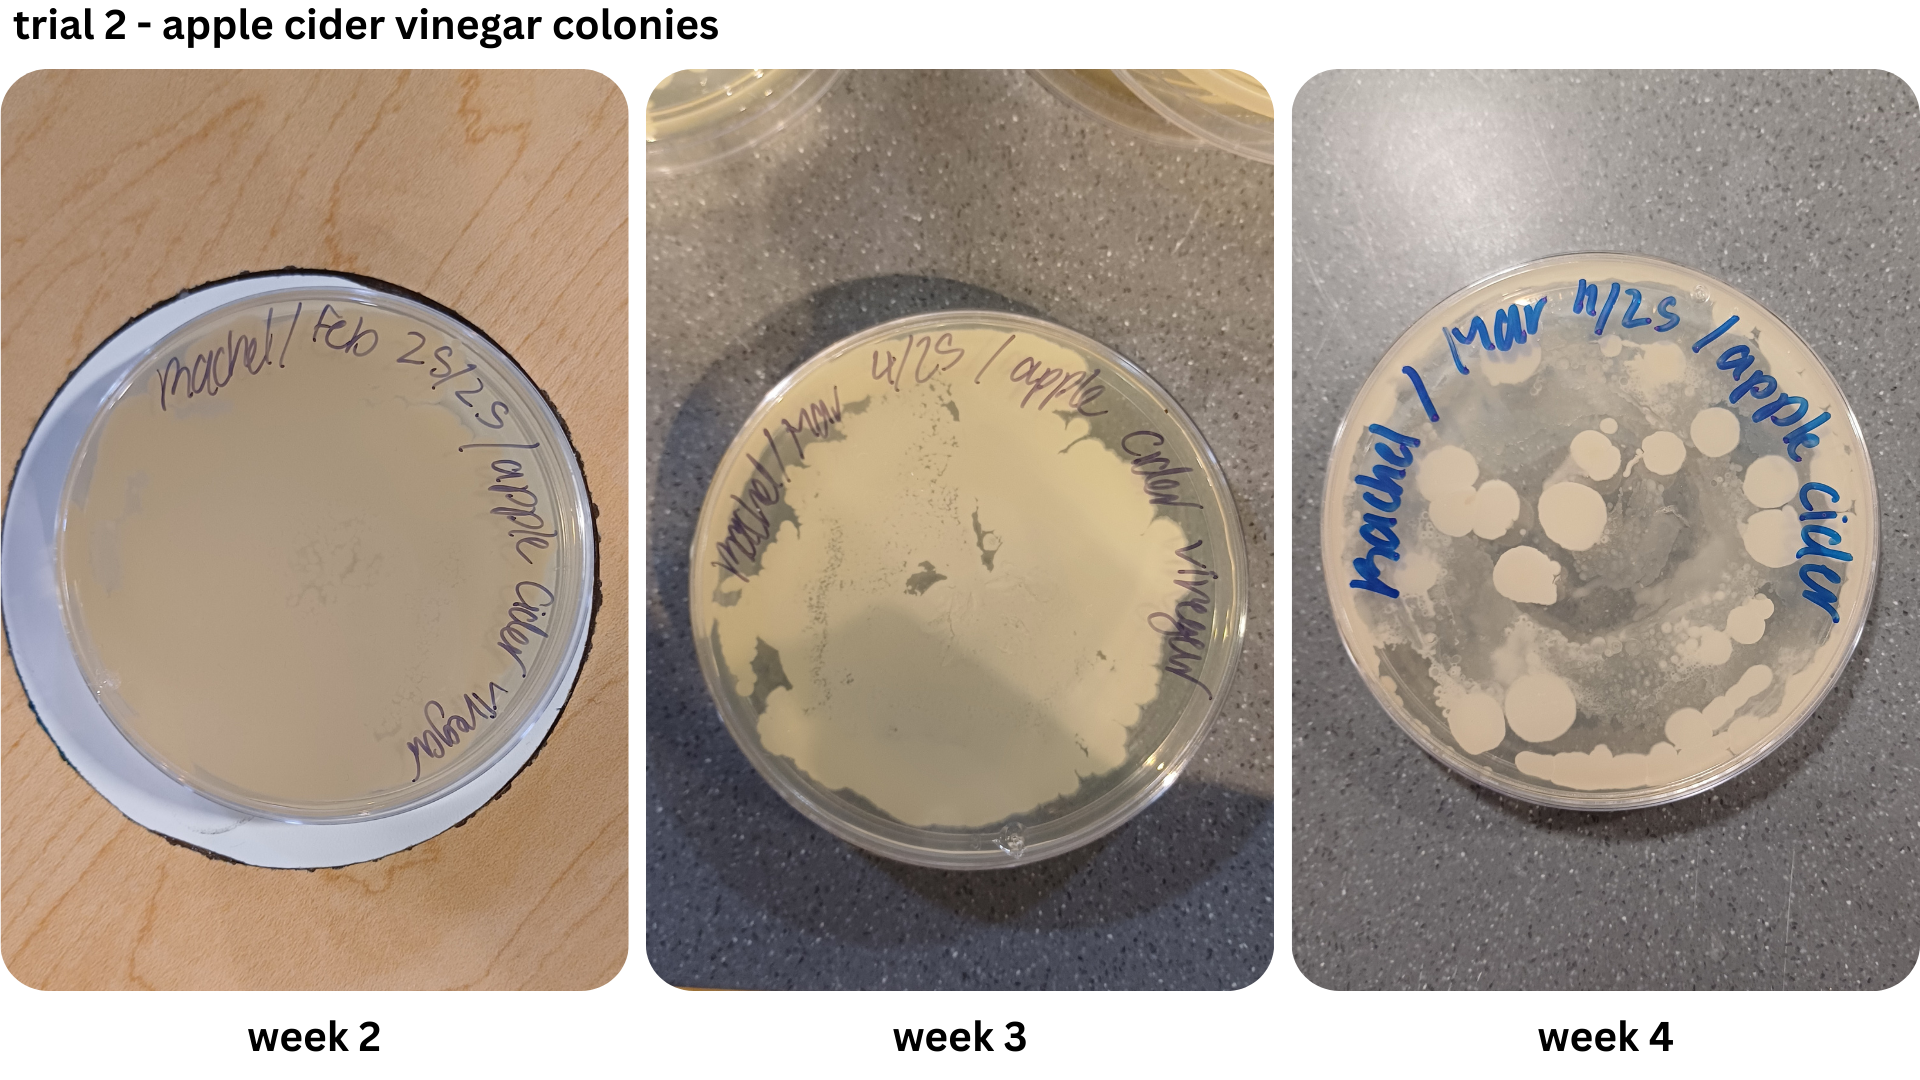
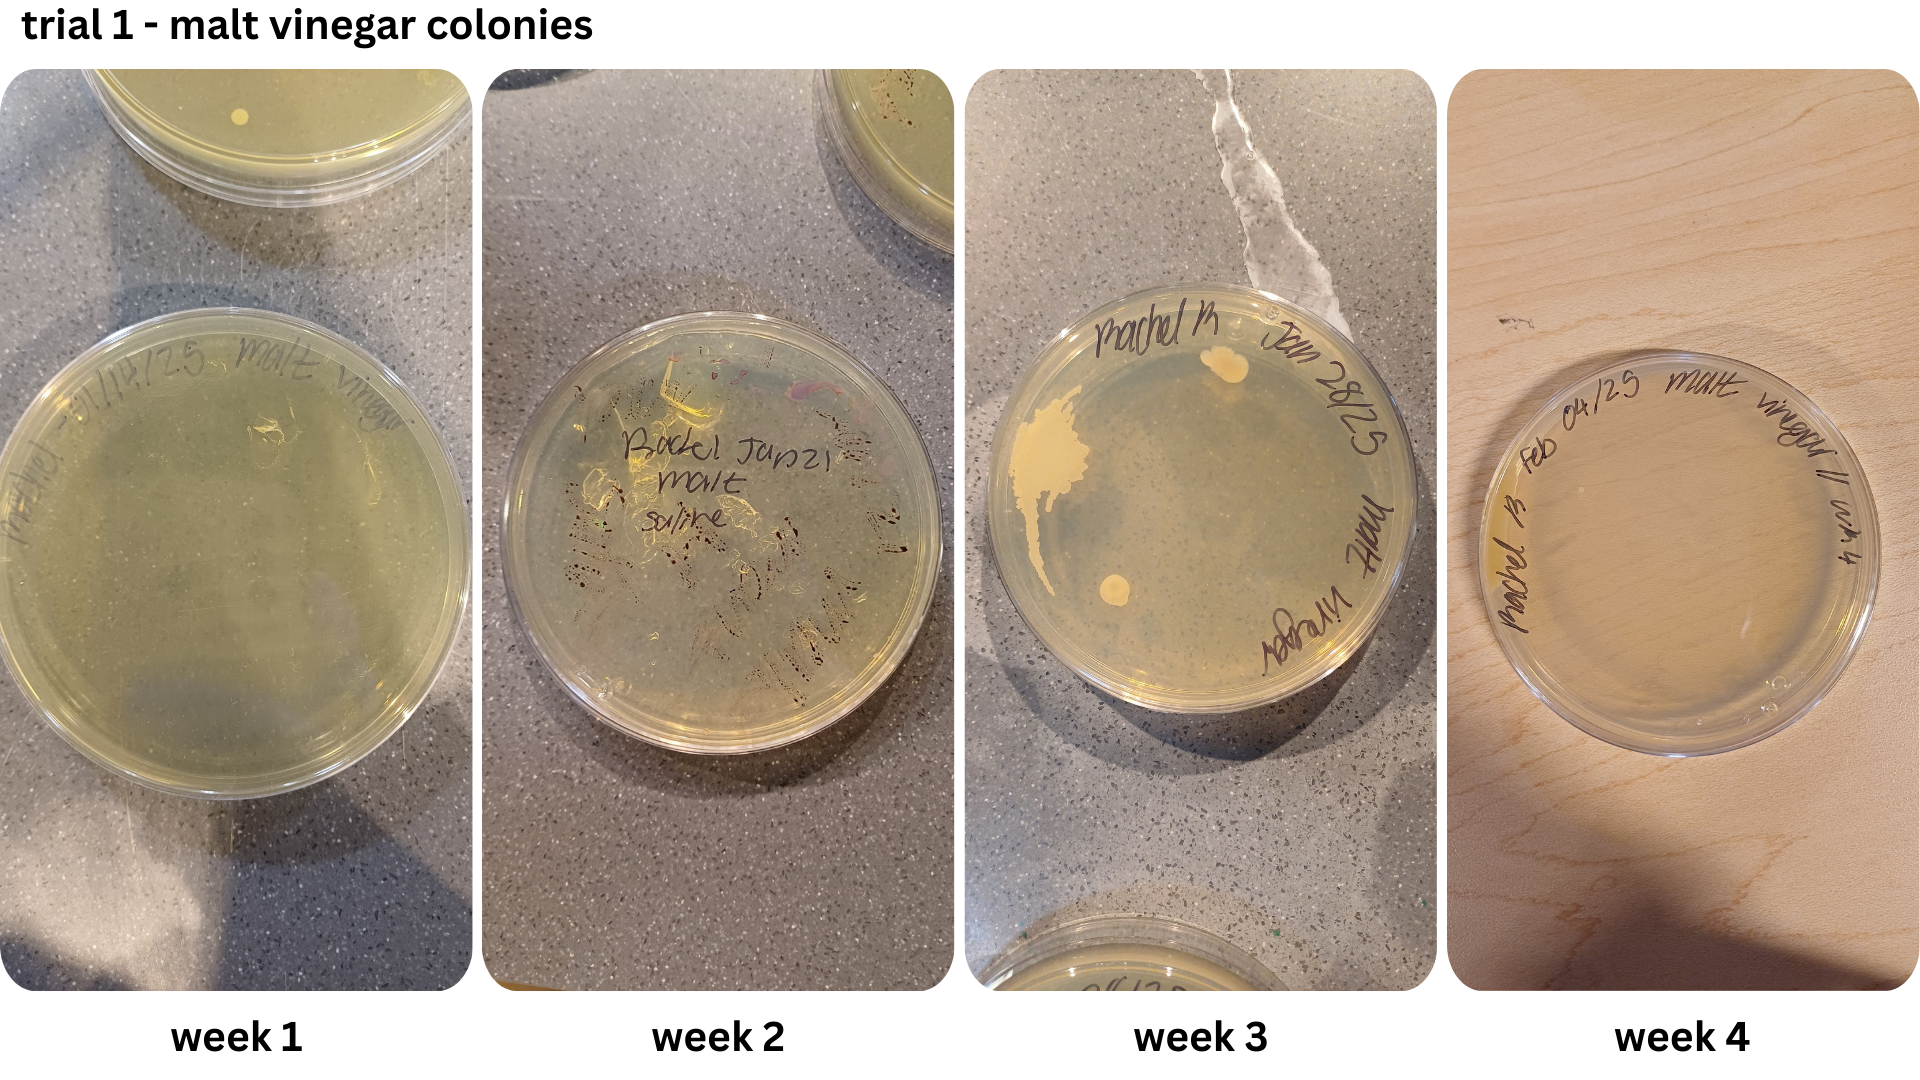
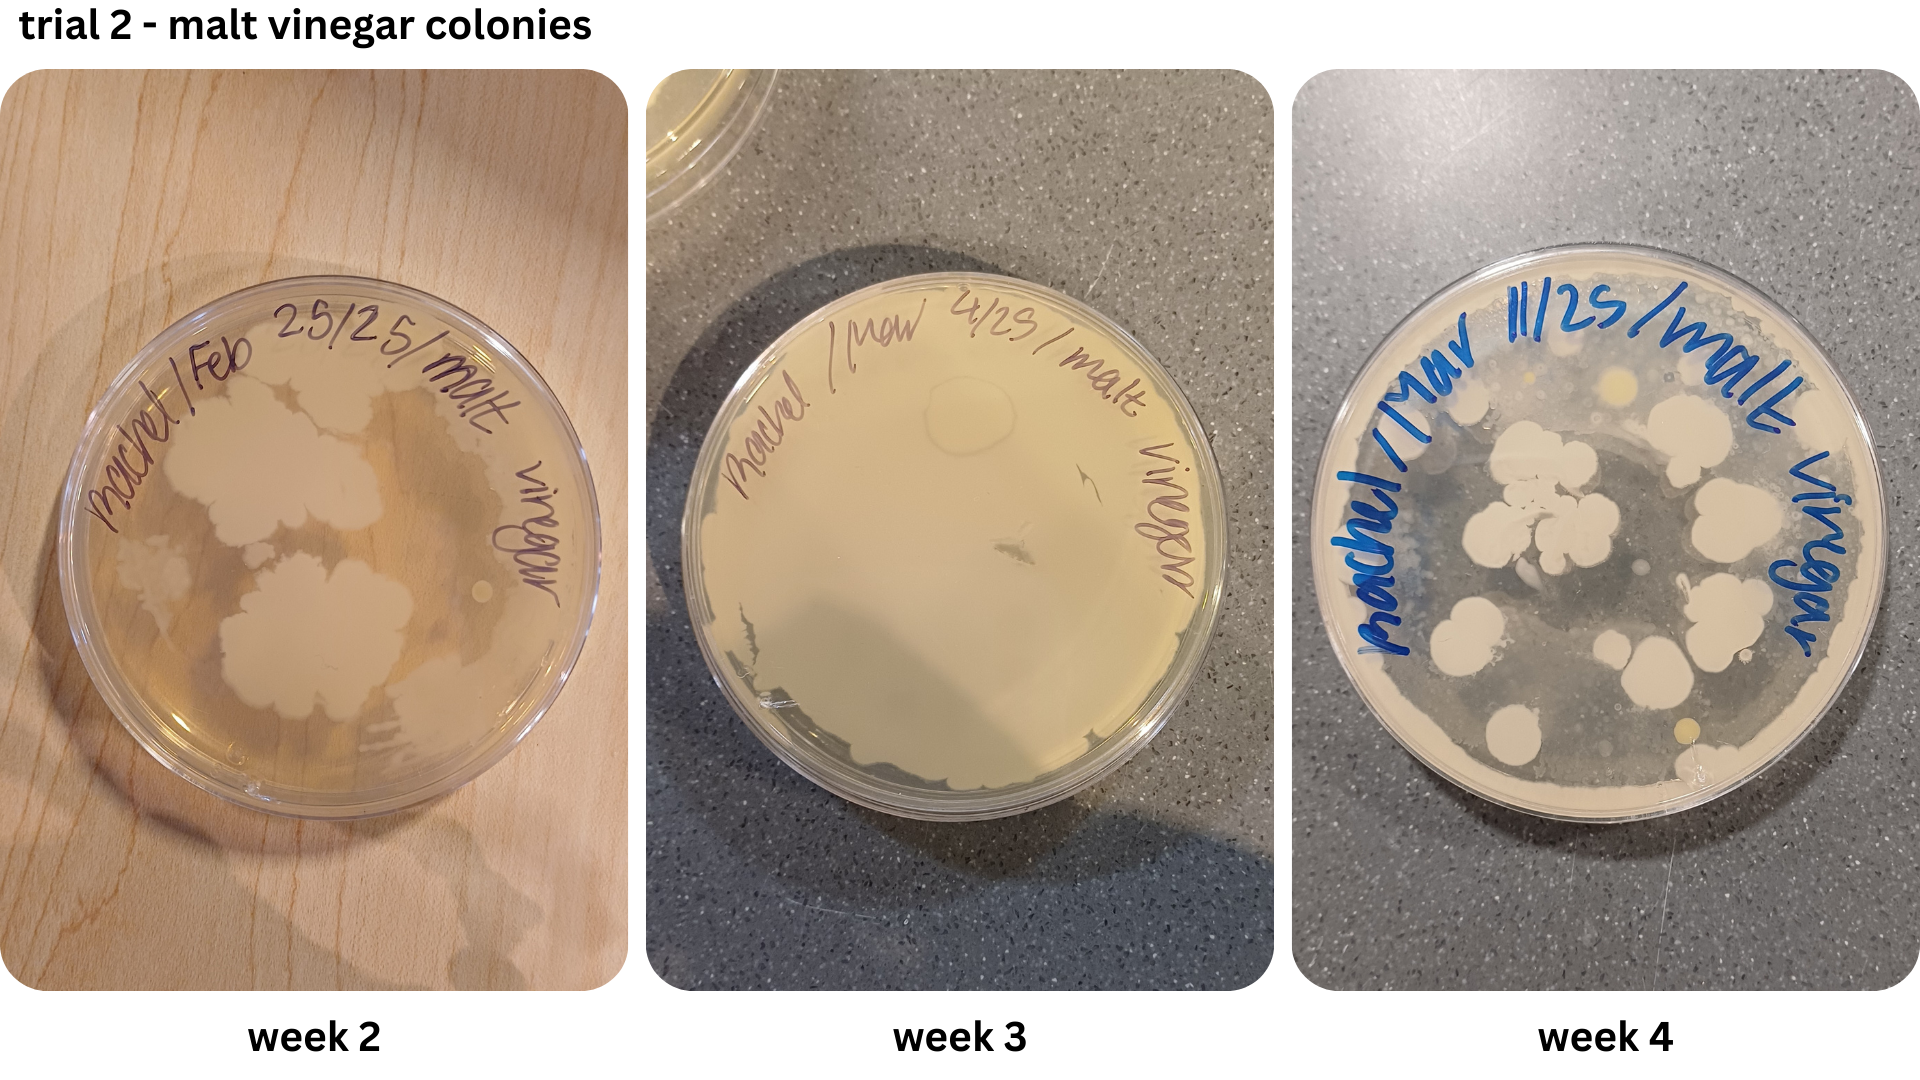
Figure 1 shows examples of Petri dishes classifed as “high”, “medium” and “low” based on the surface area of bacteria grown. As seen in Table 2, malt vinegar had the lowest bacterial growth. In contrast, apple cider vinegar had the most bacterial growth. Regarding the other two brines, white vinegar had more surface area growth compared to balsamic vinegar. The results were not consistent across the two trials, with Trial 1 yielding more “low” bacterial plates compared to Trial 2.
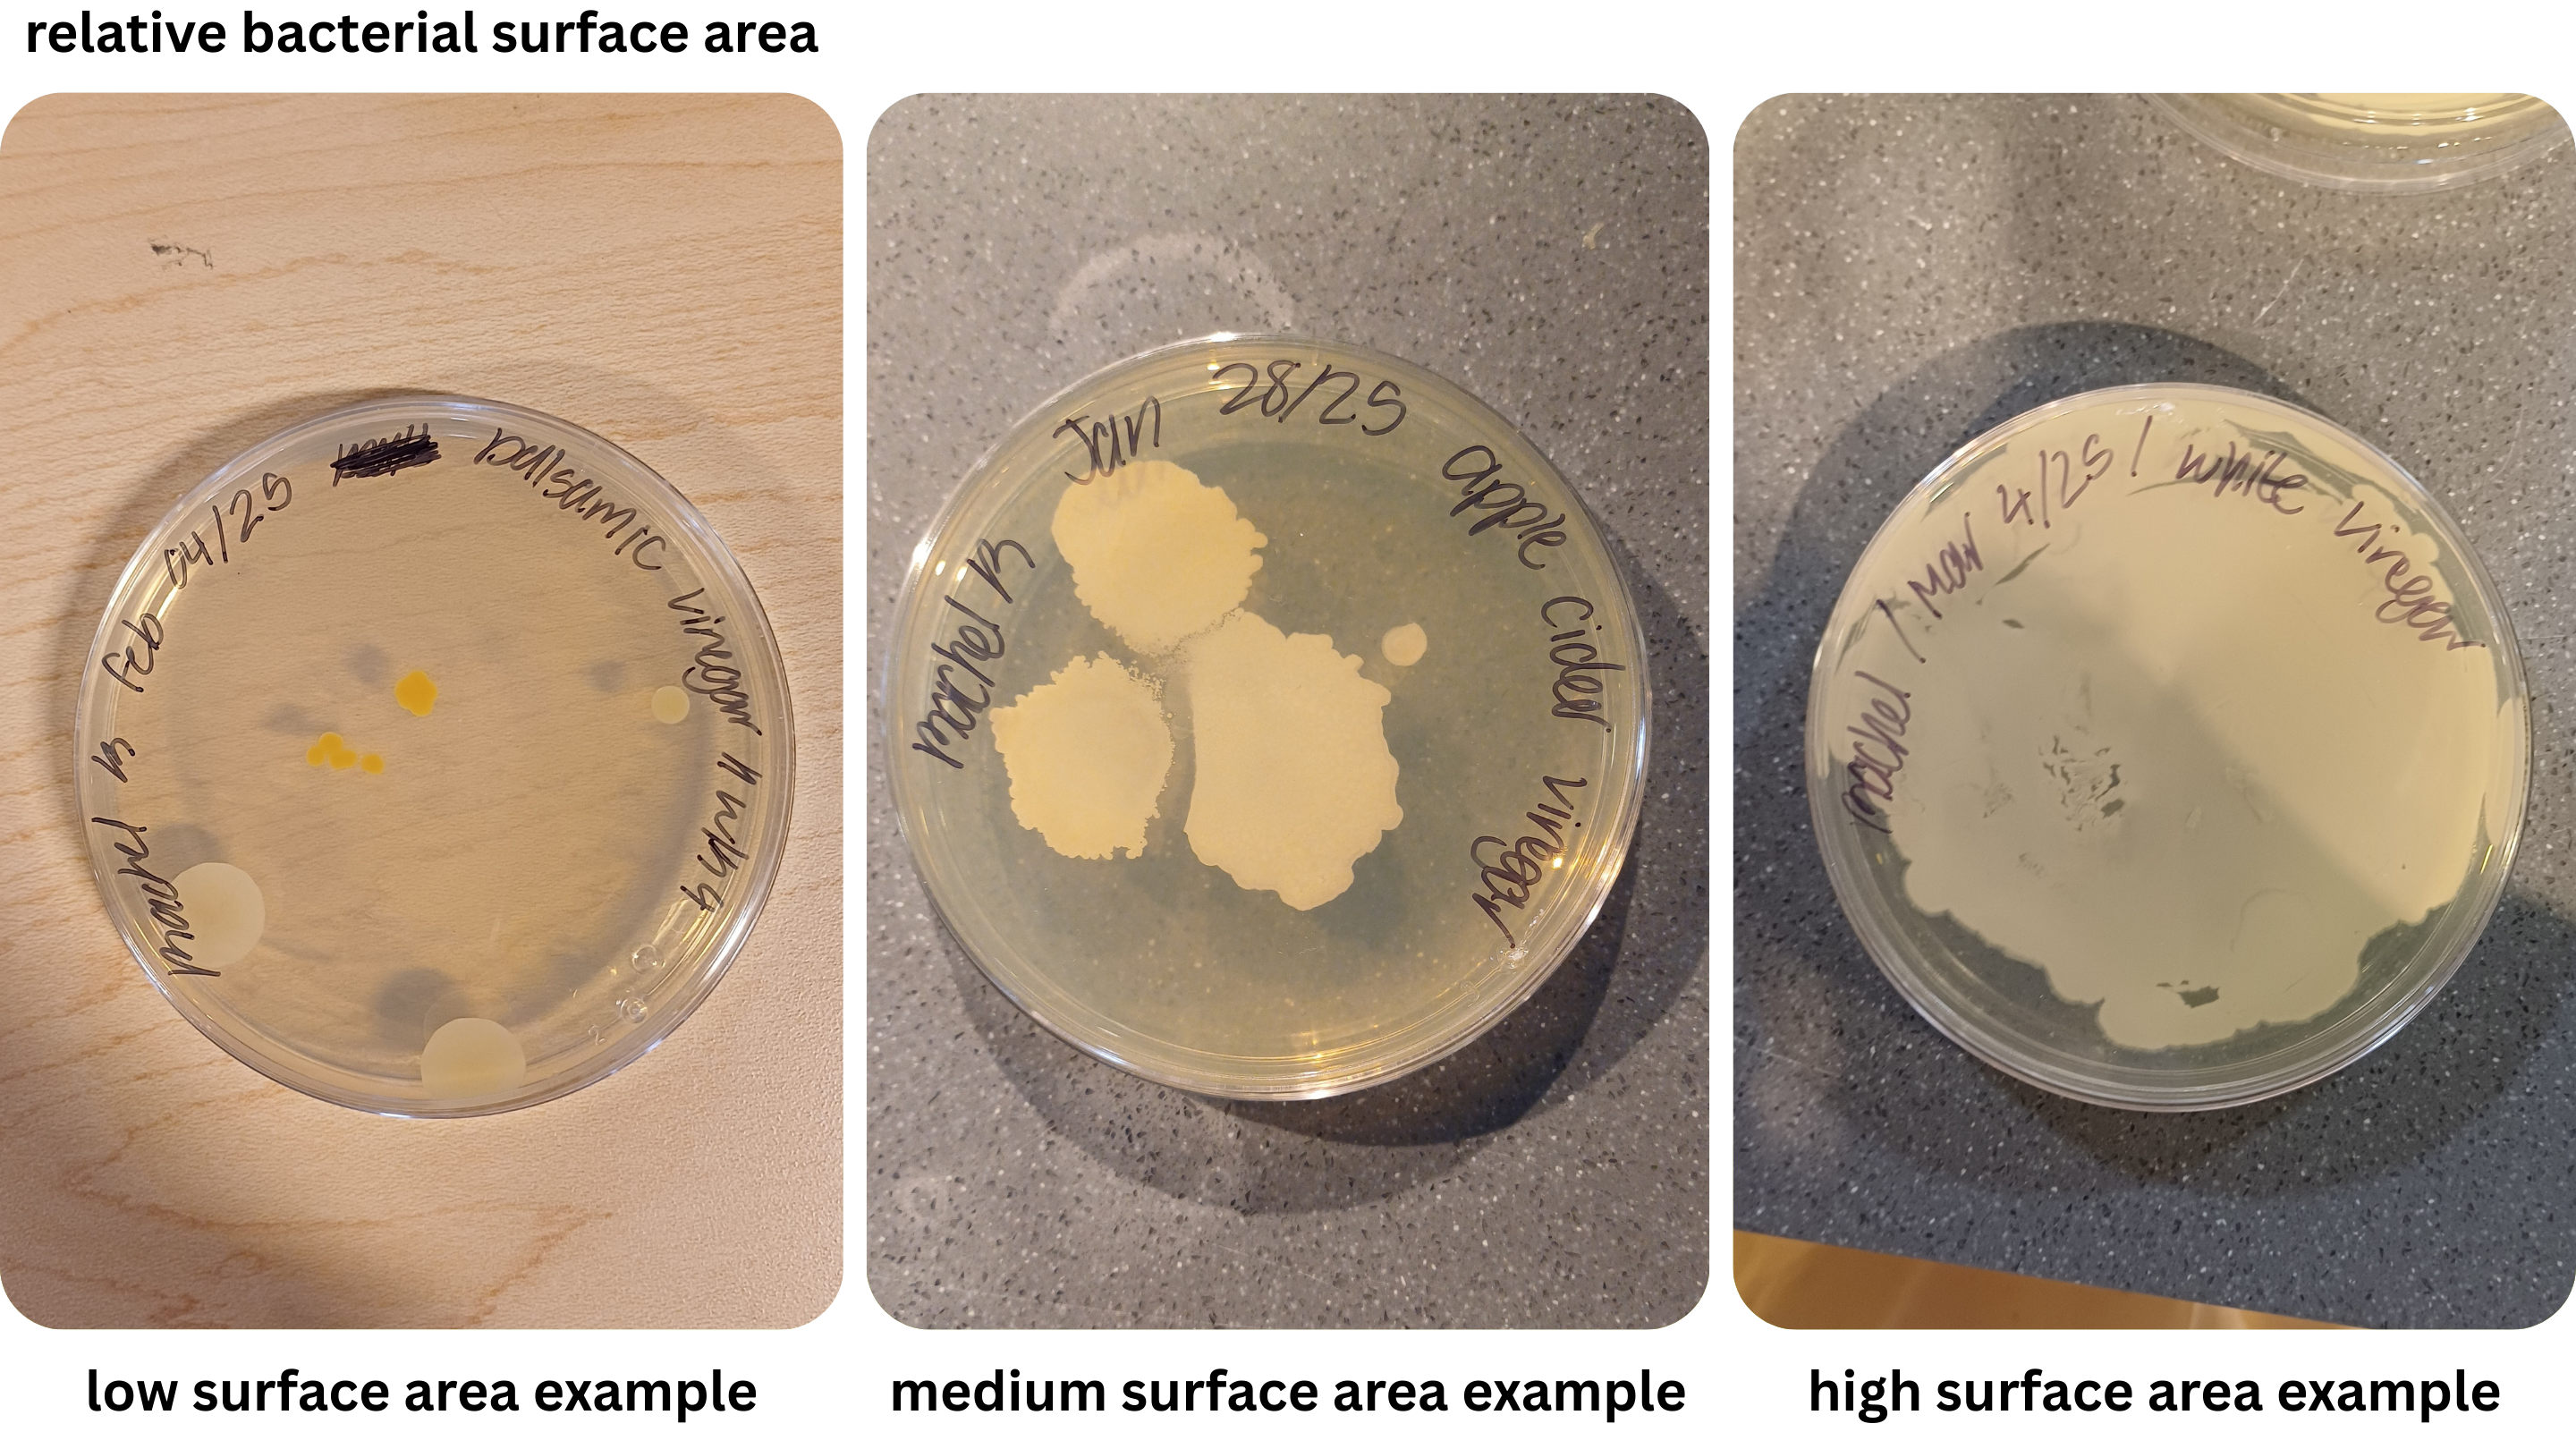
Figure 1: Visuals of low, medium, and high surface area plates
Table 2: Surface area bacterial growth relative to each Petri dish in Trial 1
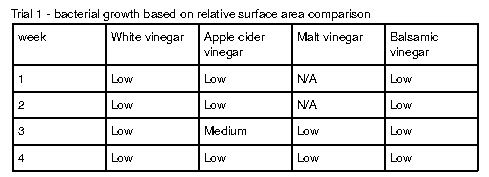
Table 3: Surface area bacterial growth relative to each Petri dish in Trial 2
Discussion
Demonstrated in Table 1, the first trial saw all brines’ pH level peak during the second week. Likewise, this pH peak was also observed in the fourth week of the second trial. Other than both trials seeing their brines peak in the same week, the pH level often fluctuated (Appendix A).
Two methods were used to collect bacteria in the first trial: streaking and spread plating. While the streaking method yielded isolated bacterial colonies, the spread plating method saw the formation of both individual and large masses of bacteria growth. After determining the saline solution method worked better for cultivating bacteria, it was used for the remaining two weeks of the first trial and the entirety of the second trial. However, the growth of bacterial lawns made the use of colony forming units difficult to estimate the number of cells. Instead, the relative surface area of bacteria on each Petri dish was compared (Table 2; Table 3).
Due to the lack of appropriate equipment, and a potential biohazard risk, it was not possible to identify the bacteria observed in the Petri dishes. However, it is likely the bacteria in Figure 1 may have been the LAB Lactobacillus (Figure 2), as previous research indicates it as a prominent bacteria during the fermentation of vegetables using vinegar (Sawada et al., 2021b, Ozer & Yıldırım, 2019). Observed in Appendix A-D, an abundance of the assumed LAB Lactobacillus has a dominant presence in both the brine and the pickles.
Figure 2: Sample image of Lactobacillus cultivated with different agar. Source: Gupta, 2017
Regarding pH level of the brines, white vinegar had the highest difference of 1.48 between its minima and maxima. Apple cider vinegar had a 1.21 difference, while malt vinegar had a pH level difference of 1.08. Finally, balsamic vinegar had a pH difference of 0.94, the lowest out of the four numbers. Trial one saw all brines’ pH level except malt vinegar peak in week two. Compared to the second trial, where all pH levels peaked in week five (Appendix A).
Taking into account both pH change and bacterial growth, apple cider vinegar had the highest bacterial growth despite its pH change being the second greatest overall. Both apple cider and balsamic vinegar were made from fruit, while white and malt vinegar were made from alcohol and barley respectively (Delany, 2017, Talerico, 2019, Masterclass, 2021, Bauer, 2024). In previous studies, beers made with ale have shown to prevent foodborne pathogen growth from 3.5-5% (Çobo et al., 2023).While balsamic vinegar is made from grapes that have fermented for 12-25 years, apple cider vinegar is made from apples fermented for two to three months. This could explain the high bacterial content grown..
In addition to LAB altering pH through the production of lactic acid, the increase of pH over time could also be impacted by the brine solution trying to reach an equilibrium of the pH within the vegetables used. Raw carrots have a typical pH level of approximately 6.1, while cucumbers have a regular pH level of 5.12-5.78 (Stephens et al., 1971, University of Wisconsin, n.d.).
During prep work, the two trials were also produced in different conditions. While the first trial’s brines had reached boiling point, the second trial’s brines had only reached the simmering point before being poured into the pickling jars due to time constraints. This mirrors the study done by Sawada et al. (2021a), where nukazuke batches were prepared with a difference in temperature level, namely during the winter and summer. The winter pickles share similarities with the second trial pickles, which had heated up to a lower temperature level relative to the first trial. This may have contributed to the greater surface area presence of bacteria from the second trial, compared to the first trial where the colonies took up less space on the Petri dishes when grown.
Contamination may explain the appearance of the orange bacteria in Appendix E1. A thin layer of paper towel was used to cover the pickles taken from the brine for bacterial sampling, and a fly was observed near the samples during the preparation of Appendix E1’s plates. Nevertheless, contamination may be a possible cause for bacteria diversity in the Petri dishes.
This research covers a case study relationship of pH level and bacterial growth in Petri dishes. Despite inconsistent preparation methods, the results provide an insight into microbial growth in pickles prepared with different vinegar brines. If replicated, this experiment should be more consistent with its preparation methods. Other future inquiries should use the colony-forming unit of measurement. This could be achieved by diluting the bacterial suspension through serial dilution before spread plating to prevent the formation of uncountable bacterial lawns. De Man-Rogosa-Sharpe agar instead of Lysogeny Broth agar to grow LAB samples for numerical estimations of colonies per millilitre (Süle et al., 2014). As this experiment took place in a lab environment, consumption of the finished product after testing was not recommended due to safety and potential biohazards. An at home version of this experiment could be remaking these pickles and recording the texture and flavour from different brines. Furthermore, taste could be recorded on a week to week basis ranging from a single person’s subjective taste, to a group setting.
References
Bauer, E. (2024). Everything you wanted to know about balsamic vinegar. Simply Recipes. https://www.simplyrecipes.com/a_guide_to_balsamic_vinegar/
Çobo, M., Charles-Vegdahl, A., Kirkpatrick, K., & Worobo, R. (2023). Survival of Foodborne Pathogens in Low and Nonalcoholic Craft Beer. Journal of Food Protection. 86 (12). https://doi.org/10.1016/j.jfp.2023.100183
Delany, A. (2017). What is white vinegar made of? Bon Appétit. https://www.bonappetit.com/story/what-is-white-vinegar-made-of#:~:text=It’s%20the%20result%20of%20a,Have%20you%20seen%20this%20bottle?&text=But%20you%20can%20also%20balance,vinegar%20is%20our%20trusty%20companion.
University of Wisconsin. (n.d.). pH values of common foods and ingredients. Clemson Education. https://www.clemson.edu/extension/food/food2market/documents/ph_of_common_foods.pdf
Gupta, Govind. (2017) Lactobacillus on MRS agar plate. ResearchGate. 10.20546/ijcmas.2017.601.059
MasterClass. (2021). What is malt vinegar? Learn how malt vinegar is used in cooking with 4 recipe ideas – 2025. https://www.masterclass.com/articles/what-is-malt-vinegar-learn-how-malt-vinegar-is-used-in-cooking-with-4-recipe-ideas
Niles, M. T., Wirkkala, K. B., Belarmino, E. H., & Bertmann, F. (2021). Home food procurement impacts food security and diet quality during COVID-19. BMC Public Health. https://doi.org/10.1186/s12889-021-10960-0
Özer, C., & Yıldırım, H. K. (2019). Some special properties of fermented products with cabbage origin: Pickled cabbage, sauerkraut and kimchi. Turkish Journal of Agriculture – Food Science and Technology. https://doi.org/10.24925/turjaf.v7i3.490-497.2350
Pruitt, S. (2015). The juicy 4,000‑year history of pickles. History.com. https://www.history.com/news/pickles-history-timeline
Sawada, K., Koyano, H., Yamamoto, N., & Yamada, T. (2021,). The relationships between microbiota and the amino acids and organic acids in commercial vegetable pickle fermented in rice-bran beds. Nature News. https://doi.org/10.1038/s41598-021-81105-x
Sawada, K., Koyano, H., Yamamoto, N., & Yamada, T. (2021b). The effects of vegetable pickling conditions on the dynamics of microbiota and metabolites. PeerJ. https://doi.org/10.7717/peerj.11123
Stephens, T.S., Saldana, G., Brown, H.E., & Griffiths, F.P. (1971) Stabilization of carreatment. Journal Food Science 36:36.
Süle, J., Kõrösi, T. Hucker, A., Varga, L. (2014). Evaluation of culture media for selective enumeration of Bifidobacteria and lactic acid bacteria. National Library of Medicine. https://doi.org/10.1590/S1517-83822014000300035
Talerico, D. (2019). Preserving Apples: How to Make Homemade Apple Cider Vinegar. homesteadandchill.com. https://homesteadandchill.com/homemade-apple-cider-vinegar/#h-step-1-gather-amp-prepare-apples-nbsp
Appendix
Appendix A: Mean pH level of brines across two trials
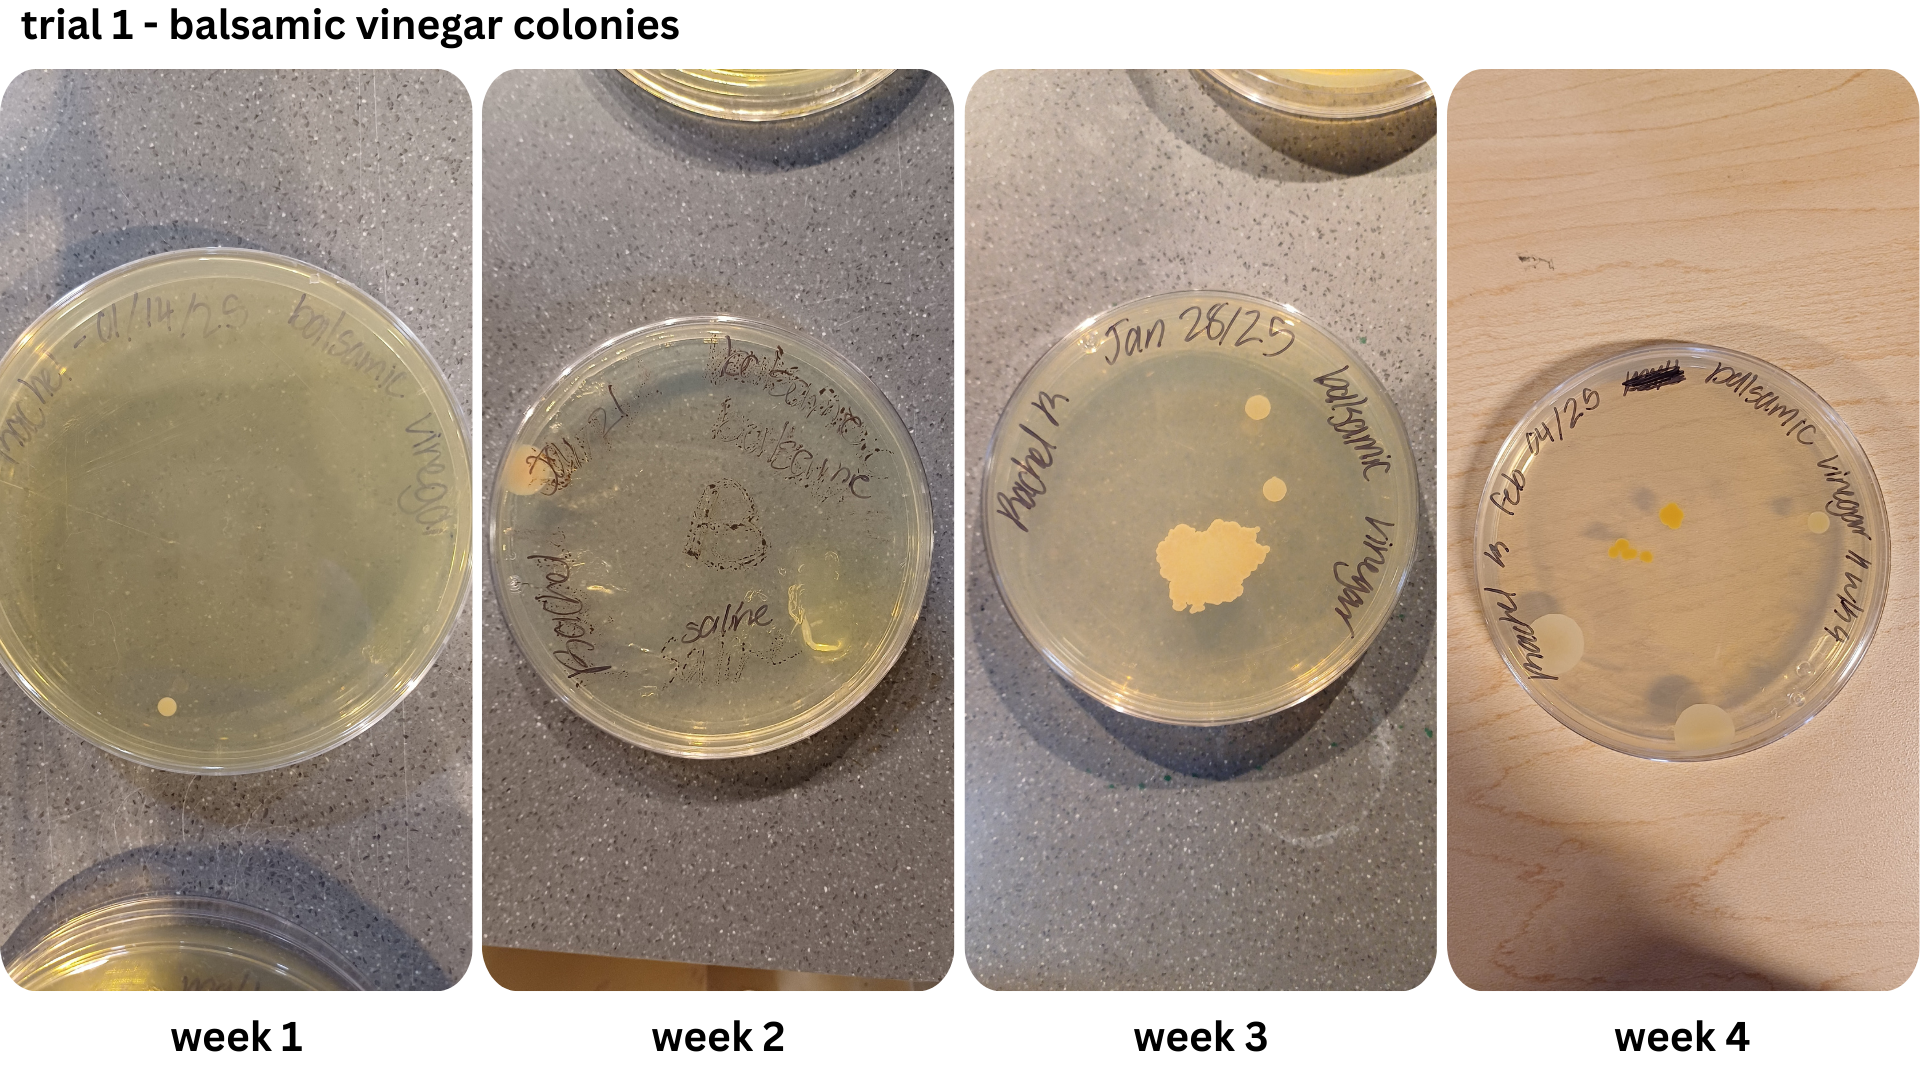
Appendix B1 & B2: Bacterial growth for white vinegar brine samples taken from weeks 1, 2, 3, 4 (B1), & weeks 2, 3, 4 (B2))
Appendix C1 & C2: Bacterial growth for apple cider vinegar brine samples taken from weeks 1, 2, 3, 4 (C1), & weeks 2, 3, 4 (C2))
Appendix D1 & D2: Bacterial growth for malt vinegar brine samples taken from weeks 1, 2, 3, 4 (D1), & weeks 2, 3, 4 (D2))
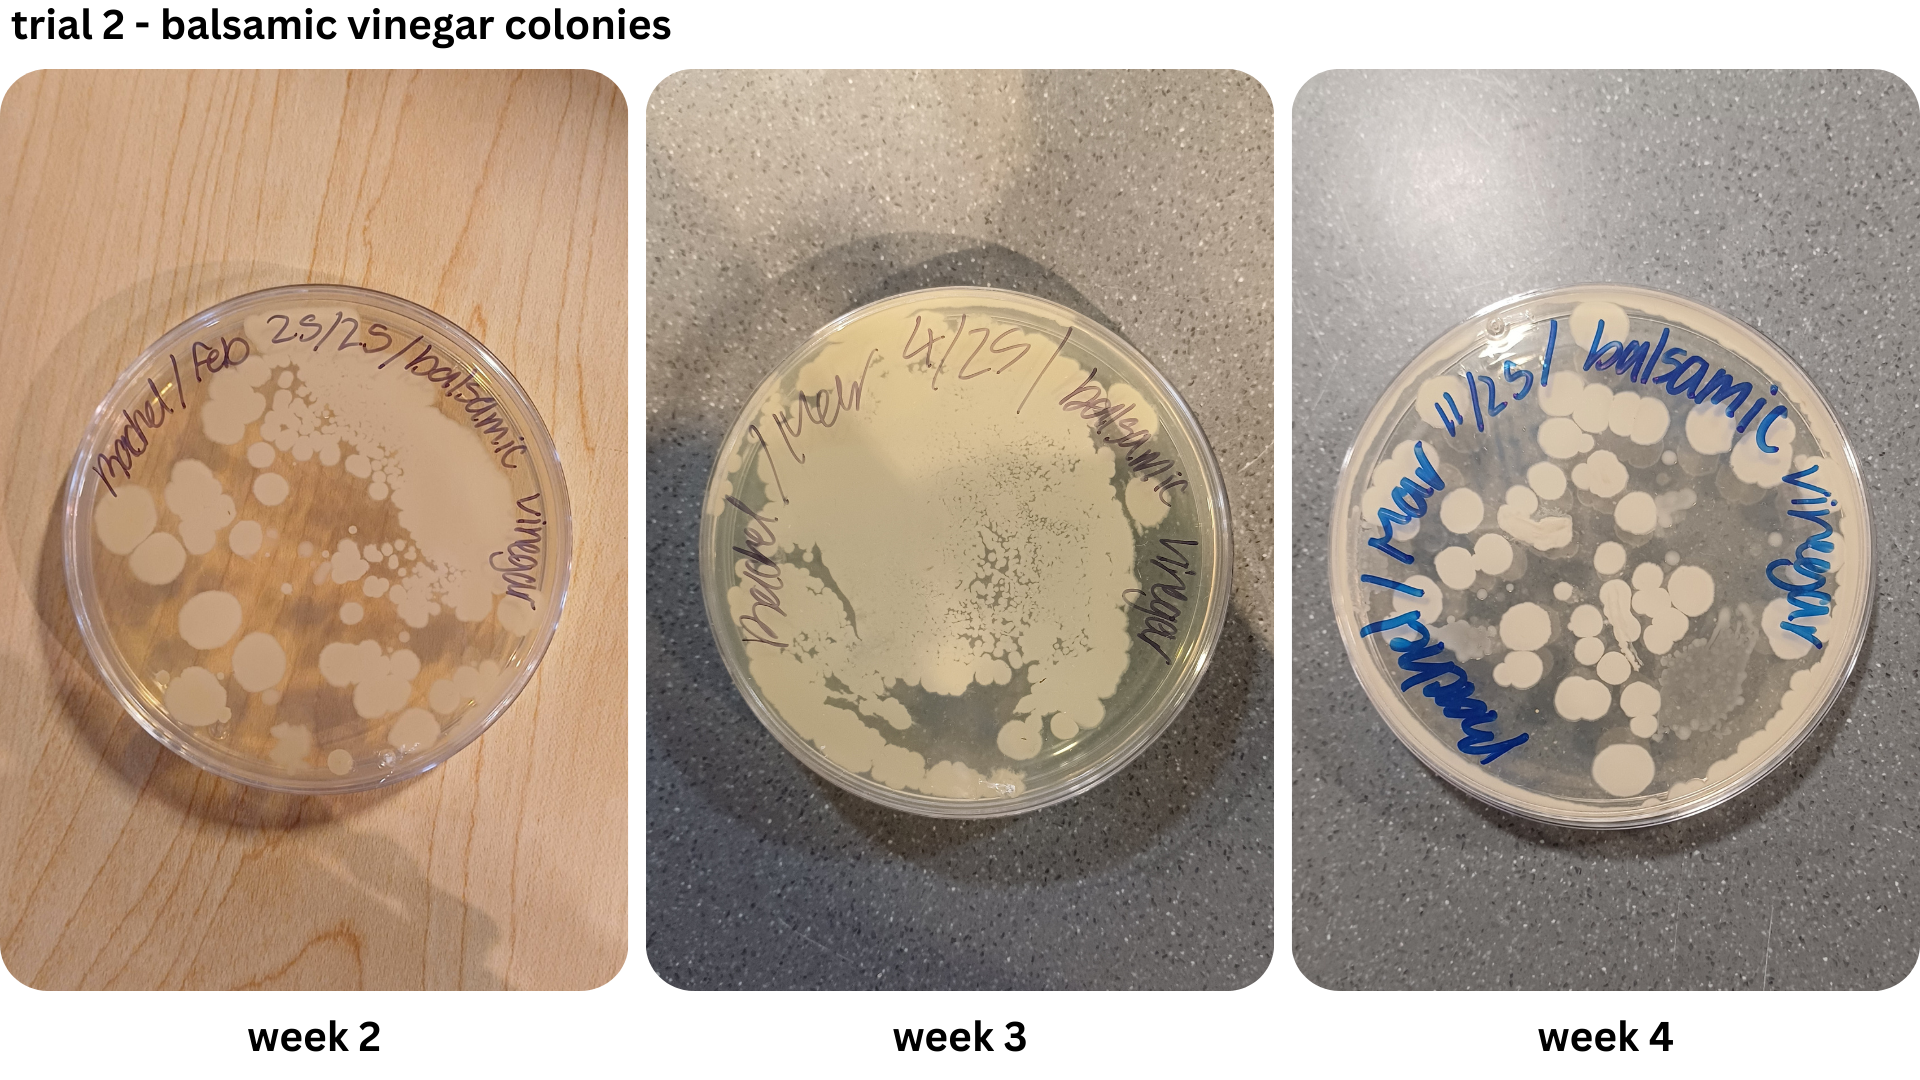
Appendix E1 & E2: Bacterial growth for balsamic vinegar brine samples taken from weeks 1, 2, 3, 4 (E1), & weeks 2, 3, 4 (E2))