Pratyusha Chakraborty – Year 2, Applied Science
Abstract
Climate change is an increasingly concerning issue and needs to be addressed as almost 83% of all energy is produced by non-renewable sources and 28% is consumed by the transportation sector globally, very little of which is renewable energy. Using the wind speed produced by a moving car to turn the blades of the turbine and placing multiple small turbines in suitable locations of the car, the battery of the electric vehicle may be extended by a renewable energy source. This project focuses on designing a small wind turbine and exploring how factors like driving speed can affect RPM, while calculating the theoretical power output and associated driving range. A prototype was made of a horizontal axis lift-based wind turbine, one of the most power efficient designs as the blades move perpendicular to the direction of the wind, increasing relative wind speed. The designs made in 3D printing softwares such as QBlade, to design and optimize the blades, and Autodesk Fusion, to design the rest of the turbine, 3D Printed using a Bambu Lab X1 Carbon printer. A ball bearing was used to connect the shaft to the hub of the turbine. Experiments were conducted in a car moving at different driving speeds and a digital photo tachometer was used to measure associated RPM of the turbine. Speeds below 25 km/h were unsuccessful in turning the blades of the turbine. Tachometer readings were then taken for driving speeds in intervals of approximately 10 km/h, from 25-30 km/h up to a speed of 95-100 km/h. The RPM generated increased linearly up to 75 km/h and then exponentially increased as wind speed increased and had a maximum of 2439 RPM. The prototype could generate a maximum power of 310.09 W and ignoring effects of the additional weight of the turbine and approximate driving speeds, was calculated to generate a maximum additional driving range of up to 11.9664 miles by driving 10 hours in a Tesla Model 3.
Introduction
Climate change is a prevalent issue that needs to be addressed at both a global and national level. The primary reason for climate change is the world’s massive levels of energy being produced by burning fossil fuels which emits greenhouse gases into the Earth’s atmosphere. In a study done in 2011 by the US Department of Energy Information, about the primary consumption of energy by source and sectors, almost 83% of all energy is produced by non-renewable sources. (Mohtasham, 2015). Non-renewable sources of energy are extremely inefficient for global long-term consumption as they are not sustainable, cannot be replenished, need to be mined and are not easily accessible due to geographical locations. This makes energy production a labour-intensive and expensive process. An effective solution to making energy production a simpler and more environmentally friendly process is to use alternate sources such as renewable energies.
A wind turbine converts kinetic energy that is obtained by the motion of the wind against the turbine’s blades into mechanical energy that is used to generate electricity, which is then fed into a generator and finally converted into electrical energy (Enel Green Power, 2023). This method of producing energy proves to be beneficial in terms of cost efficiency, as well as for the environment by avoiding emitting greenhouse gases into the atmosphere. Wind energy is sustainable in the long-term, replenishes naturally and is an accessible source of energy. The current field of work in this topic is focusing on exploring to increase capacity so that the kinetic energy can be stored and later be converted to mechanical and electrical energy when there isn’t much wind to move the turbine’s blades. One disadvantage in using wind energy as an alternative source, is the dependence of naturally occurring high wind speed, which is only consistently available in remote locations, where implementing transmission lines would be an expensive and a publicly unpopular task due to the environmental impact. Other hindrances to employing wind energy as the primary source of energy are disturbances to local wildlife such as birds, as well as the excessive production of noise which would make wind farms in urban areas a publicly challenged decision (U.S. Department of Energy, n.d.).
There are two main types of wind turbines: horizontal axis (HAWT) and vertical axis (VAWT) wind turbines. Horizontal axis turbines are the most common and efficient, generally having three blades and facing into the wind, allowing the head of the turbine to pivot. Vertical axis turbines, although less power efficient, have a vertical rotor shaft and are omnidirectional, efficient in areas where wind direction is unreliable and constantly changing (Enel Green Power, 2023). A traditional wind turbine consists of rotor blades, which create aerodynamic force through the movement of the blades due to wind speed, and a hub which connect the blades together and is connected to the nacelle, which hold all the mechanical components of the wind turbine. The mechanical process of the wind turbine includes the rotation of the rotor blades being transmitted to an input shaft which drives the generator. A gear box transforms slow rotations of the blades into faster rotations and feeds it into the generator which converts the mechanical energy into electricity. A transformer then transfers the electricity produced from the generator to the electrical grid (Enel Green Power, 2023).
The conversion of energy from mechanical to electrical is a result of aerodynamic drag or lift. Both HAWTs and VAWTs can be built utilising lift and drag forces, although HAWTs are more commonly run and influenced by lift forces. Aerodynamic drag-based wind turbines are very inefficient as the wind works against itself while rotating both sides of the rotor, and they require a high blade surface area which increases manufacturing costs. Some advantages to using drag-based machines include their self-starting capabilities at very low wind speeds compared to lift-driven turbines require much more external assistance to start (Castelli et al., 2011).
A more power efficient method is aerodynamic lift-based wind turbines, where the turbine rotor consists of a set of blades with aerodynamically shaped cross-sections. (Bukala et al., 2015). Lift-based wind turbines have blades moving perpendicular to the direction of the wind. This means that the relative wind speed increases, the limiting power is much higher than that of drag-based turbines, and they have a much more manageable blade surface area.
It is impossible to convert all the kinetic energy into mechanical energy and the theoretical maximum efficiency of this energy conversion is provided by the Betz limit. The efficiency of an ideal wind turbine depends on the upstream and downstream velocities of the wind and is given by the ratio of

where V1 is the wind speed before the turbine and V2 is the wind speed behind the turbine. Other losses in efficiency include friction on the blade surface, turbulence, and pressure equalisation.
Many technical and mechanical factors affect the power efficiency and electricity production of a wind turbine. The core factor is the speed of the wind, in which the start-up speed, cut-in speed, rated speed, and cut-out speed needs to be considered. The start-up speed is the minimum speed required to begin the rotation of the rotor blades. The speed that the wind turbine starts to generate power by converting wind into electricity is considered the cut-in speed, which according to (Marimuthu et al., 2014), is 7 – 10 mph for most turbines. The rated speed is when the turbine will generate its designed rated power, and the cut-out speed is when the wind turbine stops power generation at very high wind speeds as a safety measure. A high swept area of the turbine, which is the area captured by the rotor blade spinning through the air, is important to obtain a high-power efficiency of the turbine. The maximum power output will be obtained by the highest wind speed and is directly proportional to the swept area of the blades (Marimuthu et al., 2014).
28% of overall energy is consumed by the transportation sector (Mohtasham, 2015) and it is the sector with the smallest percentage of energy consumption by renewable sources. This project focuses on using wind energy as a renewable source to power the battery of an electric vehicle. The main objective is to make a prototype of a horizontal axis lift-based wind turbine considering all the factors necessary to create a power-efficient machine and observe, by changing certain factors such as driving speeds, how the RPM of the wind turbine changes, and if put through a generator, how much electrical energy it could theoretically produce. This would solve the problem of dependency on naturally occurring high wind speeds as the car’s speed would generate the wind required to turn the blades of the turbine. As a considerable amount of the world’s global energy production is contributed to the transport sector, and a very negligible amount of that is powered by renewable sources of energy, the implementation of small wind turbines on cars to charge their batteries, could provide a more sustainable energy source instead of fossil fuels.
Materials and procedure
A 3D Printer (Bambu Lab X1 Carbon) to print the parts of the turbine, QBlade software to design and optimize the blades, Autodesk Fusion to design the rest of the turbine, and the Model DT-2234C+ digital photo tachometer manufactured by Lazmin to measure RPM were used to execute this experiment. The overall design includes three wind turbine blades with a hub connecting the three blades. To make conducting experiments easier, a shaft was attached to the turbine which was held when experimenting. For the turbine to move while the shaft stays immobile, an ACROPIX 6208ZZ Deep Groove P5 40x80x18mm ball bearing was needed, where the inner circle doesn’t move, and the outer circle does. The ball bearing was hot glued inside the conical hub and the cylindrical shaft was tightly attached to the inner circle of the ball bearing, leaving minimal room for sliding friction. The RPM produced by the turbine was measured using the tachometer. It was held out of the car and measured manually by placing reflective tape on all the three blades.
Part 1: Designing the wind turbine
The QBlade v0.963 software was used to model the HAWT prototype using the NACA 2414 airfoil which was chosen from the NACA airfoil database. The 2414 airfoil is commonly used in the design of HAWTs. The HAWT mode and then the airfoil design tab was chosen (Sijo) (Figure 1).
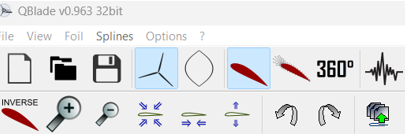
Figure 1: HAWT Mode and airfoil design tab
In the airfoil design tab, under the foil tab, NACA foils were selected, where the 4 or 5 digits chosen for this prototype was 2414 and number of panels set to 100. Right next to the airfoil design tab, under the XFoil Direct Analysis, in the polar mode, a new polar was created. The Automatic setting was chosen and the Reynolds number was set to 100000 and everything else was left as the default. A Reynolds number is used to predict patterns in a fluid’s behaviour, which in this case, is the wind. It is the ratio of the inertial forces, which resist a change in the velocity of an object, to the viscous forces, which resist flow. If the inertial forces are dominant, the flow is turbulent while if the viscous forces are dominant, the flow is laminar. It can be seen as the equation,

where ρ is the density of the fluid, V is the velocity of the flow, and L is the length scale of flow, andμ is the dynamic viscosity of the fluid. Turbulent flow is desirable for aerodynamics as it can help reduce drag and maintain a more stable airflow over the surface (Figure 2)(Simscale, 2024) .

Figure 2: Table of characterization of flow based on Reynolds number (Simscale, 2024)
The polar was then analyzed where the analysis settings were set to start at -10 deg, end at 30 deg, and change at 0.5 deg. Out of the five graphs that show up, the graph titled “Cl/Cd” which represents the graph of drag coefficient/lift coefficient vs the alpha (α), also known as the angle of attack was analyzed. The peak of this graph was an angle of attack of 8 for a Cl/Cd of 47.7.
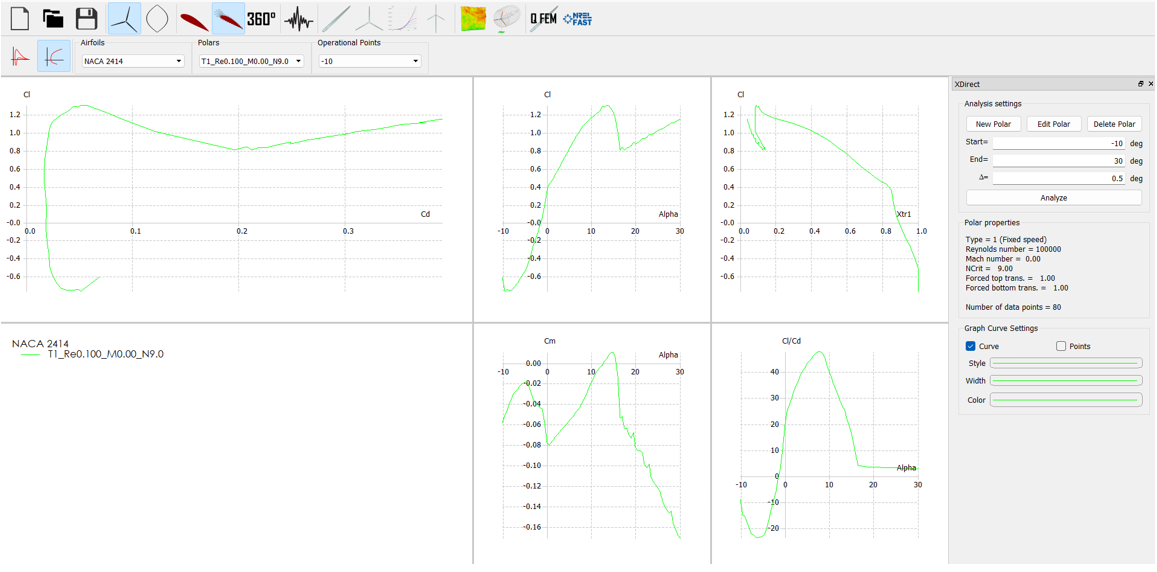
Figure 3: Creating and analyzing a new polar
In the 360 Polar tab, a 360 polar of the turbine blade had to be created (Figure 4). Under the Montgomerie setting, a 360 polar was extrapolated and saved. In the HAWT rotor blade design tab, a new blade was created. The hub radius was set to 0.03 m and around 11 sub sections to the blade, all of which have positions, chords, twist, foil, and a polar, were created. The position, in metres, increments by 0.1 from 0 to 1. The first two sub sections of the blade have a circular foil which fits into the hub of the turbine and transitions into the blade. The rest of the sub sections have a NACA 2414 foil. To generate the twist in each sub section of the blade, it was optimized by setting the angle of attack in the Opt Lift/Drag option to 8 deg. Under Opt Chord, the Betz limit was chosen to maximize efficiency and power of the blade. Finally, the model was saved as a QBlade Project File (*.wpa).

Figure 4: Position, chord, twist, foil and polar of all the sub sections of the blade
To convert the file into an STL file (which is 3D printable), in the Blade/Rotor section, “Export 3D Blade geometry in STL or text format” was chosen with the specifications of 20 chordwise points per side and 200 spanwise points. This format allowed the file to be opened in 3D printing apps such as Bambu Studio which was used to 3D print these blades using PLA with default Bambu Studio settings.
The next step is to make the hub, or center of the wind turbine. To do this, the Autodesk Fusion software was used. Since the ball bearing needs to be able to fit inside the hub, and the dimensions of the ball bearing are 40x80x18mm, the hub needed to be designed accordingly. In the top face of the window, “Create” and then “Create Sketch” was selected. A circle of diameter 81 mm was created. Then “Construct” and the circle plane were selected, at which point, an upward facing arrow showed up on the screen. The arrow was moved upward until it was around 50mm above the circular plane (Figure 5).

Figure 5: Autodesk Fusion, constructing a point above the circular plane
The “Create sketch” method was used again, and the yellow plane was selected. Under “Create”, “Point” and the center of the circle were selected. A circle with a point at its center and another point above the circle then shows up. In the front face of the window, the first profile is the circle, and the second profile is the point above it. This should create a pointed cone. To make the top curved, for the second profile, instead of selecting “sharp”, “Point tangent” was used. The “Shell” function was used, and the bottom circular plane of the cone was selected. The inside thickness was set to 5mm. The “Fillet” method was used to make a more circular holder for the ball bearing. The radius value was set to around 18mm, the width of the ball bearing.
For the turbine blades to be able to fit in the hub, three equally spaced holes had to be made above the section where the ball bearing would fit. To do this, the “Hole” method was selected to create a hole in a position above but close to the bottom section of the hub. The diameter was set to around 15mm, and the depth was around 20mm. This was done three times for three holes (Figure 6). The image was exported, saved as an STL file, opened it in BambuStudio, and printed using PLA with default Bambu studio settings.

Figure 6: Autodesk Fusion: Final design of wind turbine central hub
To create the shaft of the turbine to effectively measure the RPM, the “Create” and then “Cylinder” functions were chosen (Figure 7). The diameter was set to around 39mm, the inner diameter of the ball bearing. The length of the cylinder was set to be 150mm. The same instructions for the hub were followed to print the shaft.
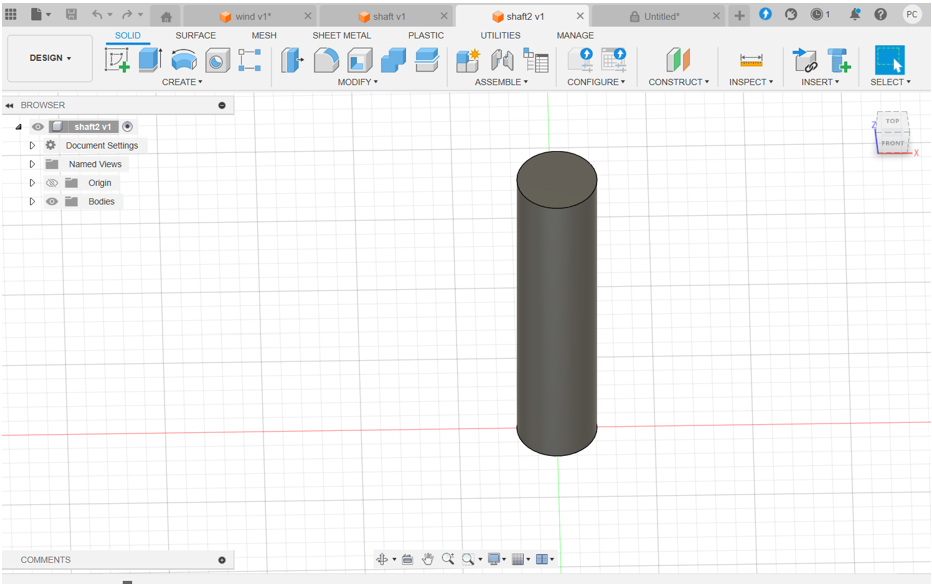
Figure 7: Autodesk Fusion: shaft of the wind turbine
Part 2: Assembling the wind turbine prototype
The final materials needed to assemble the wind turbine were 3 turbine blades, 1 central hub, a ball bearing, and a shaft. The shaft was completely fitted inside the inner diameter of the ball bearing and the hub was fitted over the outer diameter of the ball bearing. The blades were hot-glued to the central hub parallel to the base of the hub (Figure 8).

Figure 8: Assembled prototype
Part 3: Experiments
Using the reflective tape provided with the tachometer (Figure 9), two small rectangles on the underside of each turbine blade were applied (Figure 10).
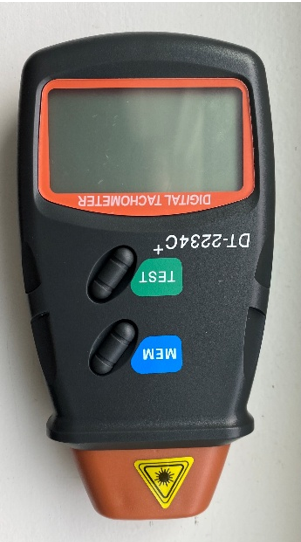
Figure 9: Tachometer used to measure RPM experimentally

Figure 10: Prototype with reflective tape attached to each blade
The reflective tape allowed the tachometer to measure the RPM while the blades were moving. The wind turbine was held out of the window and the red light that the tachometer ejects when the TEST button is pressed was concentrated on the reflective tape and the RPM was measured. To observe changes in RPM, experiments with the turbine were conducted at different driving speeds. Two trials at each selected driving speed were conducted.
Figure 11: Wind turbine turning while driving at a speed of 50 km/
Results
Table 1 and Figure 12 show the data collected in RPM by the tachometer at different approximate driving speeds.
Table 1: Data collected in RPM by tachometer in different approximate driving speeds
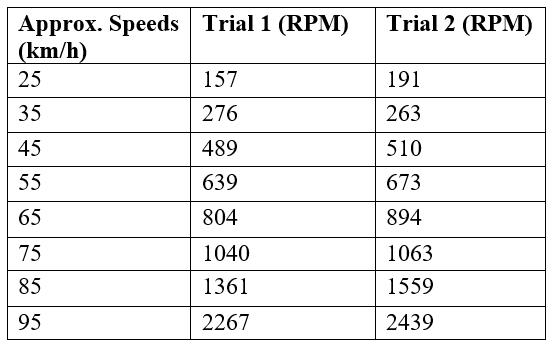
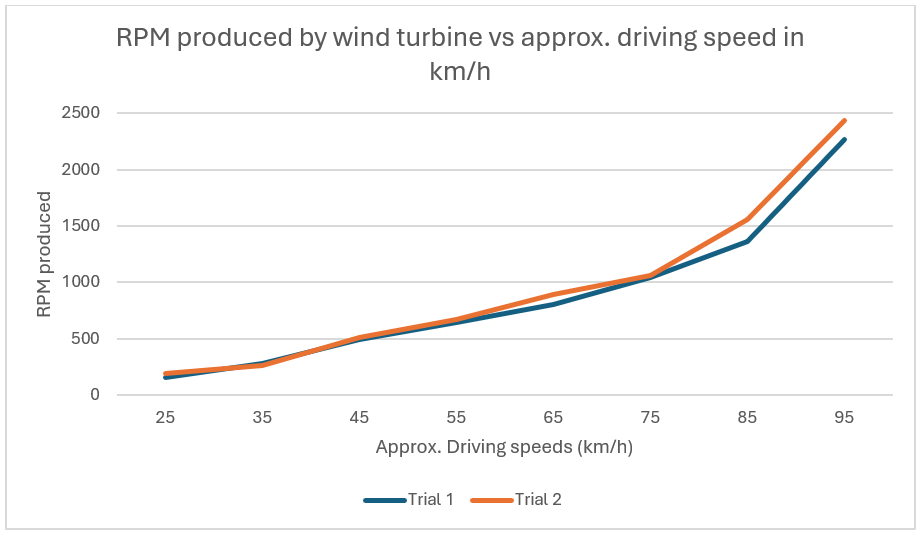
Figure 12: RPM produced by wind turbine vs approximate driving speed in km/h for two trials
Using the RPM data collected while conducting the experiments with the wind turbine prototype and the tachometer, the power output can be calculated. The equation

can be used, where τ represents the torque (Nm), ω represents the angular velocity (RPM), and P is the power measured in kW (WEN Technology, 2020).
Since torque is calculated with the equation,

where F is the lift force calculated with the equation

where Cl is the coefficient of lift, ρ is the air density (kg/m3), v is the wind velocity (m/s), and A is the wing area (m2). Using the graph of Cl vs angle of attack that was generated when creating and analyzing a new polar, for an angle of attack of 8 degrees, the lift coefficient is approximately 1.063. The wing area can be calculated using the formula for the area of a circle,
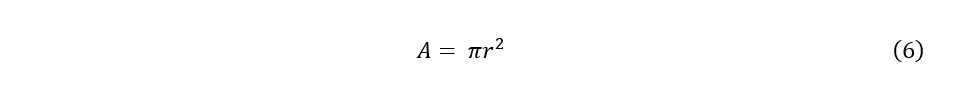
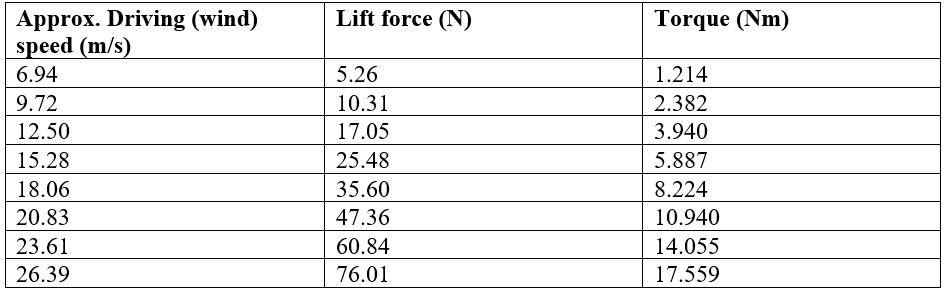
The formula of the area of a circle is used as it represents the lift force that the swept area of the blades produces. The radius (blade length) of the wind turbine was measured to be around 23.1 cm or 0.231 m. The calculated area would be 0.053 π m2. The air density, ρ of BC, Canada is 1.225 kg/m3 at standard atmospheric pressure (1 atm) and a temperature of 15°C. Since the experiments were conducted at multiple speeds, the wind speeds based on driving speed would be different for each experiment. By converting the driving speeds from km/h to m/s, the lift force and torque for each wind speed can be calculated (Table 2). Assuming negligible normal wind speed, the wind speed would be the speed that the car is moving.
Table 2: Lift force that different approximate wind speeds produce
Using the torque calculated for each wind speed as well as the experimentally measured RPM, the power range can be calculated using the formula stated above (Table 3).
Table 3: Power, in Watts, generated by RPM in different approximate driving (wind) speeds
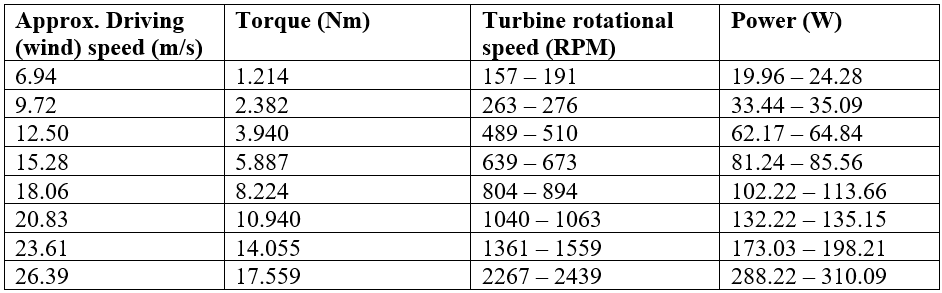
This power created by the wind turbine would then generate electricity using electromagnetic induction, where a rotating magnetic field (magnet) induces current in a coil of wire, which causes a steady flow of electricity. Small electric cars have batteries of 30-40 kWh while fully electric cars typically have batteries between 50 kWh and 100 kWh. Pickup trucks and SUVs have batteries as large as 200 kWh (EV.Guide, n.d.). The most popular electric vehicles, such as Tesla Model Y RWD and Model 3 have batteries of 60 and 57.5 kWh (EV Database, 2025). Focusing on the Tesla Model 3 EV battery, it is 57.5 kWh or 57,500 Wh with an efficiency rating of 4 miles/kWh or 0.004 miles/Wh (Dnistran, 2024). If the car ran on the same speed for 10 hours, using the power generated by the wind turbine at different driving (wind) speeds, additional driving range could be determined (Table 4).
Table 4: Additional driving range for the Tesla Model 3 battery with 57.5 kWh and 4 miles/kWh efficiency.

Discussion
Future improvements
Design of wind turbine future improvements:
One source of error that may have impacted the results of this experiment was the unaccounted weight of the ball bearing. The added weight requires the wind to do additional work to produce the same amount of RPM. Ideally, the ball bearing would add negligible to minimal weight to the wind turbine design so that the wind would have to do lesser work to provide the same amount of RPM and therefore be a more effective design. This project also neglects the additional weight that the wind turbine adds to the car as that would produce a drag force to the car’s speed and there would be a decreased power output.
Experimentation future improvements:
A source of error while experimenting was holding the wind turbine out of the car window as it spins as the same angle couldn’t be sustained throughout the entire experiment and it affected the turbine’s stability. For improved accuracy, the actual wind speed and direction could also be accounted for along with the driving speed, as it could increase or decrease the RPM. The driving speed was also inconsistent throughout each trial as the exact driving speed was not maintained and was in a range.
To further develop this project, total power output and extended driving range could be calculated when multiple turbines are connected as well as their position on the electric vehicle. This could also be implemented into regenerative braking systems of EVs so that minimal kinetic energy is lost, and efficiency is maximum.
Conclusion
In summary, this project aimed to use the RPM generated by a small wind turbine to aid in the recharging of an electric vehicle’s battery by calculating theoretical power generated and extended driving range when connected to a certain model of EV. A prototype was made of a horizontal axis lift-based wind turbine, exploring how variables like wind speed affects turbine RPM, and estimate the potential power output. The wind turbine was designed using the 3D softwares, QBlade and Autodesk Fusion, and was printed using a BambuLab 3D printer. Experiments to measure RPM were conducted using a digital photo tachometer. The RPM generated increased linearly up to 75 km/h and then exponentially increased as wind speed increased and had a maximum of 2439 RPM. The prototype could generate a maximum power of 310.09 W and ignoring effects of the additional weight of the turbine and approximate driving speed, could generate a maximum additional driving range of 11.9664 miles driving 10 hours in a Tesla Model 3.
References
Benson, T. (n.d.). The Lift Equation. NASA. https://www.grc.nasa.gov/www/k-12/VirtualAero/BottleRocket/airplane/lifteq.html
Bukala, J., Damaziak, K., Kroszczynski, K., Krzeszowiec, M., & Malachowski, J. (2015). Investigation of parameters influencing the efficiency of small wind turbines. Journal of Wind Engineering and Industrial Aerodynamics. https://doi.org/10.1016/j.jweia.2015.06.017
Castelli, M. R., & Benini , E. (2011). Comparison between Lift and Drag-Driven VAWT Concepts on Low-Wind Site AEO. International Journal of Environmental and Ecological Engineering. 1677-1682. waset.org/Publication/14505
El-Ahmar, M. H., El-Sayed, A.-H. M., & Hemeida, A. M. (2017). Evaluation of Factors affecting Wind Turbine Output Power. In 2017 Nineteenth International Middle East Power Systems Conference (MEPCON). (pp. 1471-1476) IEEE. doi.org/10.1109/MEPCON.2017.8301377
Enel Green Power. (2023). Wind turbine. http://www.enelgreenpower.com. https://www.enelgreenpower.com/learning-hub/renewable-energies/wind-energy/wind-turbine
EV Guide (n.d.) EV Battery Capacity & Estimating Range. https://www.ev.guide/lesson-articles/ev-battery-capacity-and-estimating-range
EV Database. (2025). EV Database. https://ev-database.org/cheatsheet/useable-battery-capacity-electric-car?utm_source=chatgpt.com
Dnistran, I. (2024, August 19). Cheapest Tesla Model 3 With LFP Battery Impresses In Real-World Efficiency Test. InsideEVs. https://insideevs.com/news/730570/2024-tesla-model-3-lfp-battery-effciency-test/
Lindstad, E., Ask, T. O., Cariou, P., S. Eskeland, G., & Rialland, A. (2015). Wise use of renewable energy in transport. Transportation Research Part D: Transport and Environment. 119. https://doi.org/10.1016/j.trd.2023.103713
Madara, S. R., & Selvan, C. P. (2017). Review of Recent Developments in 3-D Printing of Turbine Blades. In European Journal of Advances in Engineering and Technology. 4(7), 497-509. https://www.researchgate.net/profile/Sahith-Reddy-Madara/publication/318960215_Review_of_Recent_Development_in_3-D_Printing_of_Turbine_Blades/links/5988224745851560584e51ec/Review-of-Recent-Development-in-3-D-Printing-of-Turbine-Blades.pdf
Mantis 3D Printer. “Fusion 360: How to Make a Convex Shape.” YouTube, 7 Sept. 2020, www.youtube.com/watch?v=pZB5owGTy_Y. Accessed 26 Feb. 2025.
Marimuthu, C., & Kirubakaran, V. (2014). A Critical Review of Factors Affecting Wind Turbine and Solar Cell System Power Production. International Journal of Advanced Engineering Research and Studies. https://www.researchgate.net/profile/Mari-Muthu/publication/289504921_A_critical_review_of_factors_affecting_wind_turbine_and_solar_cell_system_power_production/links/568d429308aead3f42ed9305/A-critical-review-of-factors-affecting-wind-turbine-and-solar-cell-system-power-production.pdf
Mohtasham, Javid. “Review Article – Renewable Energies.” Energy Procedia, 74 (2015): 1289-1297. https://doi.org/10.1016/j.egypro.2015.07.774
Power-Torque – WEN Technology. (2020, May 20). WEN Technology. https://wentechnology.com/resources/calculators/power-torque/
Sijo Varghese. “Q-BLADE Tutorials for Beginners | Airfoil Design|Wind Turbine| HAWT.” YouTube, 26 July 2017, www.youtube.com/watch?v=amyTh2BYf74.
Simscale. (2024, July 31). What is the Reynolds Number? SimScale. https://www.simscale.com/docs/simwiki/numerics-background/what-is-the-reynolds-number/
“Q-BLADE Tutorials for Beginners | Blade Design |Wind Turbine| HAWT.” YouTube, 6 Aug. 2017, www.youtube.com/watch?v=fOhVfvt9fTk&list=PLcu34l7xaPqbP_DZcQosaaXqmGWIk0Gux&index=2. Accessed 26 Feb. 2025.
U.S. Department of Energy. (n.d.). Advantages and Challenges of Wind Energy. Energy.gov; Office of Energy Efficiency & Renewable Energy. Retrieved December 11, 2024, from https://www.energy.gov/eere/wind/advantages-and-challenges-wind-energy
Winslow , A. R. (2017). Urban Wind Generation: Comparing Horizontal and Vertical Axis Wind Turbines at Clark University in Worcester, Massachusetts. International Development, Community, and Environment. https://commons.clarku.edu/idce_masters_papers/127