Ella Leong – Applied Science
Abstract
Water testing has become a very important practice in today’s society. More and more people are becoming concerned about what is in the water they’re drinking. They want to be educated about the different things that could be in the water they drink every day (Allina, et al. 2012). Throughout this experiment, multiple samples of water, that the citizens of Vancouver consume every day, were tested. These water samples included; bottled water (such as Evian and Smart Water), water from multiple tap sources around Vancouver, the same tap water after being filtered by a BRITA water filter, water fountain water and Science World pond water after being filtered using a homemade camping filter. Test strips were utilized to test the water samples for free bromine, copper, iron, lead, pH, total chlorine, and free chlorine. All the bottled, tap and water fountain samples were found to have metal and pH levels that are within Canada’s drinking water guidelines, excluding the pond water, which should not be consumed. For future work in this area, it is recommended that the experiment is repeated to determine if the time between collection and testing has an impact on the accuracy of the pH level results. The microplastic content of the water samples could also be calculated.
Introduction
Researchers around the world test water properties such as the level of different hard metals, chemicals, and pH, to determine if the water is safe for human consumption. Many countries around the world follow the GDWQ (Guidelines for Drinking Water Quality) to set national drinking water quality standards (World Health Organization, 2012). In British Columbia, there is a legislation about the quality of the drinking water that is safe to be consumed (Government of British Columbia, 2016). Multiple studies have been conducted in Pakistan (Younas et al. 2023) , Ethiopia (Yilkal et al. 2019), Iraq (Toma, 2013), and Canada (Schwartz et al, 2021), with academic papers being published as a result, to find the level of heavy metals in the drinking water in those countries, with the intent of identifying possible carcinogenic effects they could have on the people drinking the water.
To narrow down the research geographic area, the water was collected in Vancouver, from the tap and water fountains found in schools, community centers and Science World, BRITA filtered tap water, bottled water that can be purchased in local stores, and lastly water from the pond outside at Science World. This research will summarize specific parameters of the composition of the water people drink, such as the pH level, and amount of toxic metals or chemicals that can be found in the water. In addition, it will allow people to assess if there are different brands of water that have more or less of a certain chemical and if there is a brand that is preferred based on the results. This research will indicate if there are varying amounts of chemicals, in the Vancouver tap water and fountain water, in different locations around the city, depending on where the water is collected from. This will allow people to learn more about the diverse types of heavy metals, pH, and chlorine that can be found in their drinking water, filtered water, and the bottled water that they buy. The results will help people stay informed on their choices of drinking water.
Materials and Methods
In this experiment, different water samples were collected and tested. The first group of samples were from bottled water typically found in Vancouver, specifically Evian Pure Life, Dasani, and Smart Water. The second group of samples was water direct from taps at a private residence in Vancouver, École Secondaire Jules-Verne, and Science World. The third group of samples was the tap water from the same three locations filtered using a BRITA water filter. The fourth group of samples was drinking fountain water from the same three locations as the tap water. The fifth and final sixth group of samples was water from the pond at Science World that was tested unfiltered and then filtered using an experimenter-assembled charcoal and sand-based filter. The properties in the waters were then tested using chemical test strips by the GAOQSEMG company, purchased on Amazon. These test strips provide results for the levels of free bromine, copper, iron, lead, pH, total chlorine, and free chlorine in each of the waters tested. The temperature of the waters was tested using the Etekcity Infrared Thermometer 774, Digital Temperature Gun from Science World to ensure that it was between 2°C and 30°C at time of testing. Additional pH tests were used to determine the variability in the different types of test strips used and to see if different results would be obtained.
Testing criteria
The amount of water that was tested was to be 175mL and between 2°C and 30°C, in order for the test strips, made by the company GAOQSEMG, to provide accurate results. Once the water had been tested, it was crucial for the results to be noted in the first 30 seconds of the strip being out of the water, otherwise the results could be inaccurate, as the color could have faded and or changed after that time.
Testing process
The first round of water samples that were tested were bottled water brands that are typically found in Vancouver such as Evian, Pure Life, Dasani, and Smart Water. The water was first put into clean individual 250mL beakers. They were rinsed with tap water and dried with paper towels before adding the different types of water into the beakers to test, with 175mL of water in each. The temperature of the water was then tested using the Etekcity Infrared Thermometer 774, Digital Temperature Gun. The water samples were then tested for pH level, using various methods, such as a Dr. meter pH meter provided by Science World, test strips made by Hydrion, test strips made by Carolina, and a test strip pack with a 16 in 1 Water Test Kits for Drinking Water, made by GAOQSEMG. Next, the bottled water was tested for levels of free chlorine, total chlorine, free bromine, copper, iron, and lead using the GAOQSEMG 16 in 1 Water Test Kits for Drinking Water. Lastly, the results of each of the tests were placed into a table to organize the findings. The steps above involving the pH tests and chemical test strips were repeated three times for each type of water tested, to be able to compare the results in each series test.
All the steps were then repeated for each of the remaining 5 groups of water samples collected for testing
The BRITA water filter that was used for the experiment was new at the outset of the experiment, so it had not been previously used. The BRITA water filter was prepared for use according to the instructions in the BRITA user manual. In addition, the water that was utilized from the private residence and École Secondaire Jules-Verne were all collected throughout the day and therefore were not tested at the time of collection. 175mL of water was measured before putting it through the BRITA water filter.
The last type of water to be tested was collected from the outdoor pond at Science World. It was first tested in its unfiltered state and then tested again after being filtered using a homemade camping filter. This filter was made using a plastic water bottle, sand from Science World, Organika Activated Charcoal Powder, and one typical cotton pad. The testing method for the pre and post filtered pond water samples was consistent with the other groups of water samples.
The Carolina test strips, used to test the other types of water, were normally tested three times for each type of water but, for the pond water after being filtered, there were only test strips left to test the water twice.
Results
Sample group 1 – bottled water
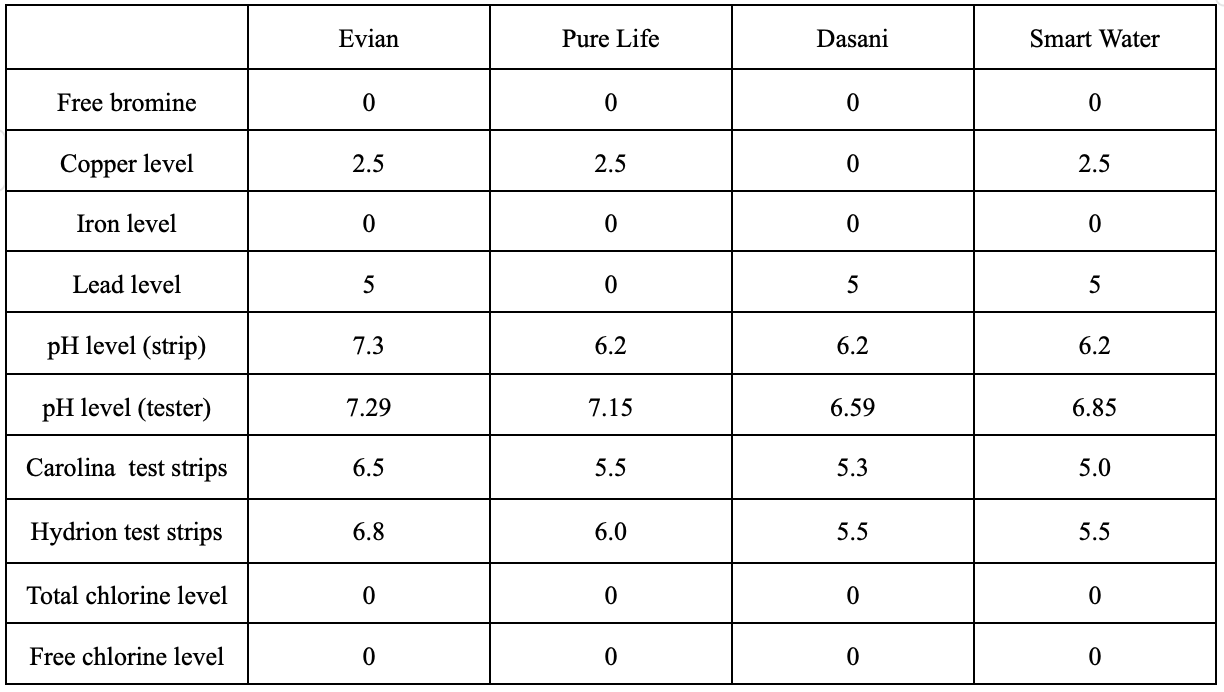
See Table 1 for the average results of the three tests conducted per the method for each of the bottled waters. Smart Water stayed consistently at a level of 2.5 mg/L for the level of copper in the water, while the others samples averaged 0 mg/L .The level of pH in Evian water and Pure Life water stayed consistent, they were mostly neutral (7.0-7.5) or slightly acidic (6.5-6.9). The pH levels in Dasani water and Smart Water had a few results of very acidic water (5.0).
Table 1 – Averages of test results for bottle water samples (mg/L)
Figures 1 shows an example test strips 30 seconds after submersion in the water sample, when results are to be interrupted.
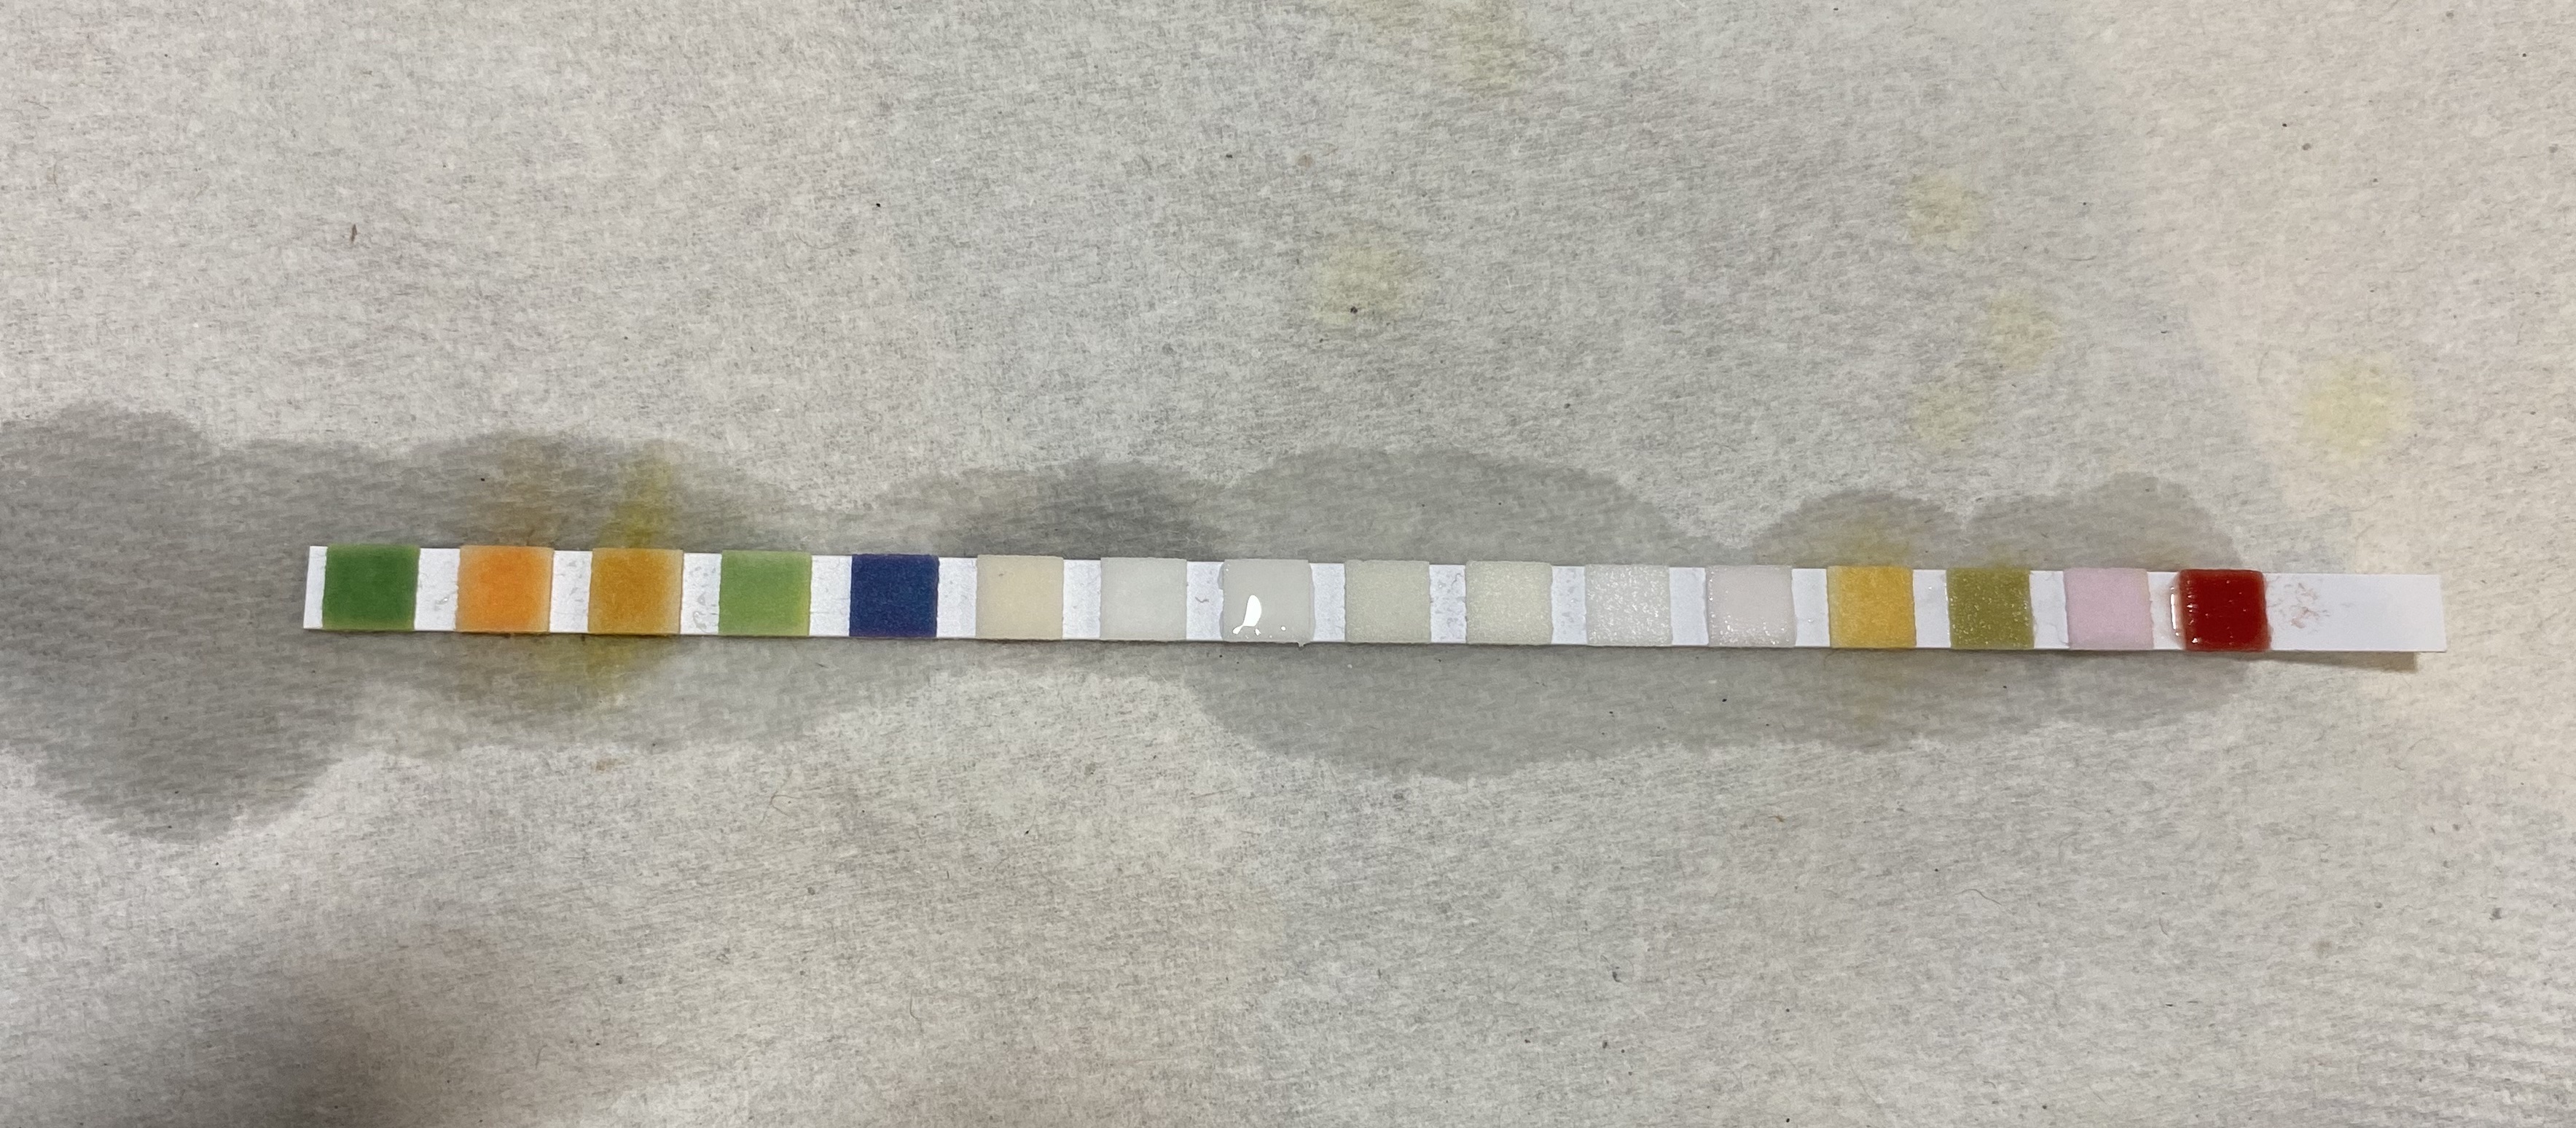
Figure 1: example test strip results 30 seconds after submersion – Evian test #1
Sample group 2- unfiltered tap water
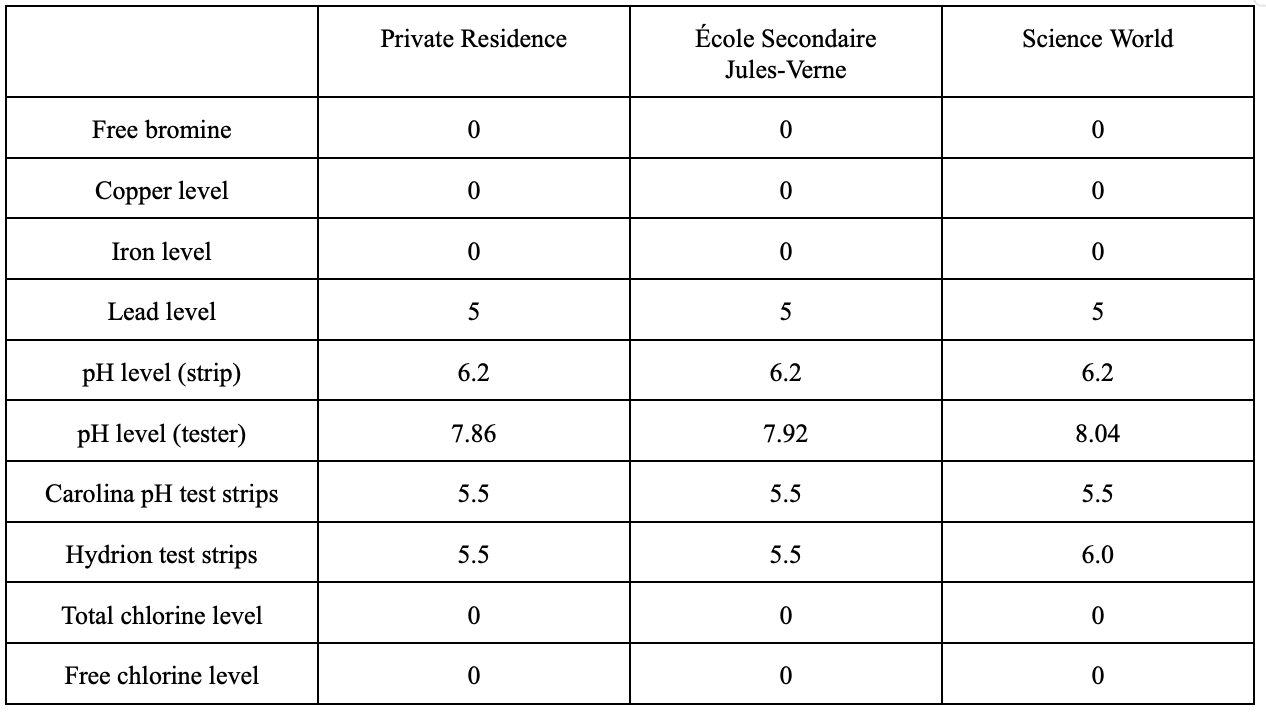
See Table 2 for the average results of the three tests conducted per the method for the different samples of tap water. In the four samples of tap water that were tested, the level of heavy metals stayed at a consistent level of 0, except for the level of lead in the water, which remained at a level of 5 mg/L for all of the tap waters. The pH in the different tap waters stayed uniform, the results were mostly acidic (5.0-6.4) water or alkaline water (7.5-8.5).
Table 2 – Averages of test results for unfiltered tap water samples (mg/L)

Figure 3 and 4 show example test strips 30 seconds after submersion in the water sample, when the results are to be interrupted.
Sample group 3 – tap water filtered using BRITA filter:
See Table 3 for the average results of the 3 tests conducted per the method for the samples of tap water filtered by a BRITA water filter. In the four tap waters tested after using the BRITA water filter, there was an amount of lead, mostly at a level of 5 mg/L, compared to the acceptable amount of 0,005 mg/L per the drinking water guidelines (Government of Canada, 2019); this is consistent with the lead level found in all of the tap water samples before filtering. In addition, the amount of copper present in the filtered water was 2.5 mg/L, which is an increase compared to the unfiltered samples which had a level of 0. The pH level for each of the filtered waters also was consistently acidic (5.5-6.5).
Table 3 – Averages of test results for tap water samples filtered using BRITA filter (mg/L)

Sample group 4 – water fountain samples:
See Table 4 for the average results of the 3 tests conducted per the method for the samples of water fountain water. In the water fountain water, that was tested in 3 different locations, from École Secondaire Jules-Verne, Science World, the fridge dispenser at a private residence, the level of pH remained consistent at either acid (5.5-6.5) or alkaline (7.5-8.5). The level of heavy metals stayed consistent throughout the tests; most metals stayed at a level of 0 mg/L with a few results of 5 for the level of lead.
Table 4 – Averages of test results for water fountain samples (mg/L)
Sample group 5 – unfiltered Science World pond water:
See Table 5 for the results of the 3 tests conducted per the method for water obtained from the Science World pond upon collection. Before being filtered with the camping filter, the water had a pH level that was either acidic (6.0-6.2) or neutral (7.0-7.5). The level of heavy metals stayed consistent throughout the tests, all metals were at a level of 0 mg/L, except for the copper level, which was at a level of 2.5 mg/L.
Table 5 – Test results for unfiltered Science Park samples (mg/L)

Sample group 6 – filtered Science World pond water
See Table 6 for the results of the three tests conducted per the method after the pond water was filtered using a homemade camping filter. The filtered Science World pond water had a consistent acidic pH level (6.0-6.4). The level of heavy metals remained the same as the unfiltered water in all of the tests, except for the level of lead, which was at a level of 5 mg/L.
Table 6 – Test results for filtered Science World pond water samples

Discussion
All the potable water samples were found to have metal and pH levels that aligned with Canada’s drinking water guidelines. The guidelines detailed that pH levels should be between 7.5 to 10.5, lead should be less than 0.005mg/L of lead, iron levels should be zero, copper should be less than 2mg/L and chlorine and bromine should be zero or none (Health Canada, 2015) which all of the waters met, except for the level of lead. It is unclear what the units for lead were on the test strips used, and it would be worth retesting using a more accurate method to make sure the waters have a safe amount of lead. Therefore, it is possible that the strips were mislabelled and gave the wrong measurements for lead, as it is unlikely that all of the water contained 5 mg/L of lead. Some water sources were found to have more preferrable levels than other water sources as detailed in sections below.
One of the key limitations of this experiment, is that no bacteriological testing of the water samples was able to be completed. Cities that are responsible for drinking water distribution are required to conduct bacteriological testing, in addition to the metals and pH testing completed as part of this experiment, in order to determine if the water is safe for consumption.
One of the key parameters tested in this experiment was pH level, which varied the most within sample groups and comparing between sample groups. There are a number of possible limitations that may have impacted the pH results, including the type of test and when the pH level test was conducted. Specifically, when testing the pH of the water samples using the Carolina pH test strips, the results were constantly acidic. The levels remained at either 5.5 or 6.0. This likely means that the Carolina pH test strips were not providing an accurate pH level results and the other pH testing methods should be relied upon instead. This could be because of the age of the test strips. The Carolina pH test strips could have been old test strips, therefore giving inaccurate results.
Further, throughout the experiment, there were multiple sources of water that were not tested at time of collection , such as the bottled water samples, the water collected from the private residence as well as the water collected from École Secondaire Jules-Verne. According to the United States Environmental Protection Agency,
“pH can be analyzed in the field or in the lab. If it is analyzed in the lab, you must measure the pH within 2 hours of the sample collection. This is because the pH will change due to the carbon dioxide from the air dissolving in the water, which will bring the pH toward 7.” (United States Environmental Protection Agency, 2012).
Since the bottled water samples, the water collected from the private residence and École Secondaire Jules-Verne were not tested within the 2-hour window, there is a possibility that the pH changed to a more neutral result throughout the day and lead to inaccurate results.
Sample group 1- bottled water testing
The conclusion of the testing was that the best brand of bottled water that can be found in Vancouver is Evian water, due to its consistent level of 0 in heavy metals and a consistent neutral or slightly acid in the pH level, and the worst brand of bottled water that can be found in Vancouver is Dasani water, due to its higher acidity.
Sample group 2 – tap water
When testing the water samples, the levels of heavy metals and pH stayed consistent with each test strip throughout the different types of water. The water sample collection location had no significant impact on the results and did not vary the number of heavy metals or the level of pH.
Sample group 3 – tap water testing with BRITA filter
As the tap water was collected from the same area for both this test (sample group 3) and the previous test (sample group 2), the limitations to this test are comparable. As a result of the experiment, it is better to drink from tap water, rather than drink from tap water that was filtered using a BRITA water filter. This is because the BRITA water filters were found to add a certain amount of copper into the water, did not filter out any lead present in the sample, and made the water more acidic.
Sample group 5- water fountain water testing
When testing the water fountain water from different areas in the city, the water was not tested at time of collection so, this could lead to inaccurate pH levels. The fridge water from the private residence and the sample from Ecole Secondaire Jules Verne were collected earlier in the day, but both were tested in the evening,. The water fountain water collected from Science World was tested shortly after collection so there is likely no inaccuracy of pH due to time between collection and testing.
Sample group 5- unfiltered Science World pond water
As the water being tested was collected from the Science World Pond, the water was tested shortly after collecting, therefore, there should not be any changed levels of pH before testing. The unfiltered pond water was found to be unsuitable for human consumption.
Sample group 6 – filtered Science World pond water
When the water was filtered through the homemade camping filter, not all of the water filtered through therefore reducing the sample volume compared to the amount that was initially collected. It is assumed that a lot of the water was absorbed into the sand and charcoal components of the filter. The end result after having been filtered was around 25mL of water opposed to 175mL of water. The water from the filter was not collected on the same day as the initial test, therefore, the pH likely changed throughout the week compared to results from sample group 5, which affected the final results. That being said, the level of pH in the water after being filtered was much more acidic, which indicates that it could have been the filter that caused the water to become more acidic compared to a lowering of pH that is typically observed as time passes The level of lead after the filter was at a level of 5 mg/Lcompared to a level of 0 that was found for the unfiltered water. This could mean the filter caused the level of lead to increase because of the charcoal or the sand that was in the filter. The level of copper also did not change, which means that the filter did not help in filtering the metals. Both the filtered and unfiltered water samples were observed to be the same colour, which indicates that the filter was not effective in removing particles in the water.
Conclusion and Next Steps
In conclusion, all the bottled, tap and water fountain water samples were found to have metal and pH levels that are within the Canada’s drinking water guidelines, excluding the pond water, which should not be consumed. For future work in this area, it is recommended that it the experiment is repeated to determine if the time between collection and testing has an impact on the accuracy of the pH level results. This could be achieved by testing the water samples that were collected outside of Science World at time of collection. Furthermore, it would be a good comparison to see if the fountain water results change after being filtered by the BRITA water filter. This will allow another aspect to compare the efficiency of the BRITA water filters, and if they make a difference on the water people drink.
Lastly, in future experiments similar to this one, a recommendation would be to find a way to calculate the amount of microplastics that are in the water people drink.
References
Ashley, R. D. (2018, August 31). Ask the Doctors – Is water with a high pH safe to drink? UCLA Health. Retrieved March 6, 2024, from https://www.uclahealth.org/news/ask-the-doctors-is-water-with-a-high-ph-safe-to-drink
Castrodale, J. (2023, August 29). Class Action Lawsuit Claims Brita Is Misleading Customers. Food & Wine. Retrieved March 6, 2024, from https://www.foodandwine.com/brita-class-action-lawsuit-7963133
City of Vancouver. (n.d). Drinking water monitoring and results. City of Vancouver. Retrieved March 6, 2024, from https://vancouver.ca/home-property-development/drinking-water-monitoring-and-results.aspx#reports
Government of Canada. (2019, 13 March). Guidelines for Canadian Drinking Water Quality: Guideline Technical Document – Lead. Government of Canada. Retrieved March 6, 2024, from https://www.canada.ca/en/health-canada/services/publications/healthy-living/guidelines-canadian-drinking-water-quality-guideline-technical-document-lead.html#
Health Canada. (2015, August). Guidelines for Canadian Drinking Water Quality: Guideline Technical Document – pH. Canada.ca. Retrieved April 21, 2024, from https://www.canada.ca/en/health-canada/services/publications/healthy-living/guidelines-canadian-drinking-water-quality-guideline-technical-document-ph.html#
How to make a water filter with sand and charcoal (DIY experiment). (2018, July 2). YouTube. Retrieved March 6, 2024, from https://www.youtube.com/watch?v=ICYNtiU7r6I
Province of British Columbia – Legislation.(2016, February 29). Gov.bc.ca. Retrieved March 6, 2024, from https://www2.gov.bc.ca/gov/content/environment/air-land-water/water/water-quality/drinking-water-quality/legislation
Province of British Columbia – Drinking Water Quality. (2022, August 17). Gov.bc.ca. Retrieved March 6, 2024, from https://www2.gov.bc.ca/gov/content/environment/air-land-water/water/water-quality/drinking-water-quality#
Ravanipour, M., Hadi, M., Rastkari, N., Borji, S. B. H., & Nasseri, S. (2023, January 6). Presence of heavy metals in drinking water resources of Iran: a systematic review and meta-analysis. SpringerLink, Springer Berlin Heidelberg. Retrieved March 6, 2024, from https://link.springer.com/article/10.1007/s11356-021-13293-y
Schwartz, H., Marushka, L., Chan, H. M., Batal, M., Sadik, T., Ing, A., Fediuk, K., & Tikhonov, C. (2023, January 6). Metals in the drinking water of First Nations across Canada. SpringerLink, Springer International Publishing. Retrieved March 6, 2024, from https://link.springer.com/article/10.17269/s41997-021-00497-5
Steinberg, B. (2023, September 1). Brita filter packaging misleads consumers, class-action lawsuit claims. NY Post. Retrieved March 6, 2024, from https://nypost.com/2023/09/01/brita-filter-packaging-misleads-consumers-class-action-lawsuit-claims/
Toma, J. J. (2017, November 9). Quality Assessment of Some Bottled Water That Available in Erbil City, Iraq by Using Water Quality Index for Drinking Purposes. Science Journal of University of Zakho. https://sjuoz.uoz.edu.krd/index.php/sjuoz/article/view/217. Retrieved March 6, 2024, from https://sjuoz.uoz.edu.krd/index.php/sjuoz/article/view/217
United States Environmental Protection Agency. (2012, March 6). 5.4 pH | Monitoring & Assessment | US EPA. EPA Archive. Retrieved April 21, 2024, from https://archive.epa.gov/water/archive/web/html/vms54.html
Why Your Brita Filter May Be Contaminating Your Water. (n.d.). Guardian Water Services. Retrieved March 6, 2024, from https://www.guardianwaterservices.com/brita-filter-contaminating-water/
World Health Organization. (2021, December 16). A global overview of national regulations and standards for drinking-water quality, 2nd ed. World Health Organization (WHO). Retrieved April 9, 2024, from https://www.who.int/publications/i/item/9789240023642
Yilkal, E., Zewge, F., & Chandravanshi, B. S. (2019, March 2). Assessment of the quality of bottled water marketed in Addis Ababa, Ethiopia | Bulletin of the Chemical Society of Ethiopia. African Journals Online. Retrieved March 6, 2024, from https://www.ajol.info/index.php/bcse/article/view/184067
Younas, K., Jamil, A., & Saleem, A. R. (2017, November 9). Carcinogenic effect of potential toxic metals in school children through contaminated drinking water around the industrial area of Pakistan. Wiley Online Library. Retrieved March 6, 2024, from https://onlinelibrary.wiley.com/doi/10.1002/tqem.21979