Brandon Wu – Applied Science
Abstract
This experiment investigates how running in heart rate Zone 2 versus Zone 3 impacts running economy and how efficiently the body consumes oxygen during aerobic exercise at various intensities. The participant underwent 10 Zone 2 runs and 9 Zone 3 runs at increasing paces on a treadmill over 10 weeks, measuring their mode heart rate of each run to calculate their running economy. A strong negative linear correlation was concluded for Zone 2 (r = -0.93) and Zone 3 (r = -0.78) in pace versus running economy, verifying past research findings. However, a low/no correlation was concluded for Zone 2 (r = -0.07) and Zone 3 (r = 0.10) in heart rate versus running economy. The data collected was inconclusive to find a definitive relationship between running at different heart rate zones and running economy. Confounding variables including anatomy/physiology, fuel mix, and running form were found to possibly affect running economy.
Introduction
For runners, achieving faster times and greater endurance is a constant endeavour. Yet, amidst the miles and sweat, the topic of Zone 2 versus Zone 3 training remains a hot debate in the fitness community. According to Goodlife Fitness, both zones are “[f]or the longest training sessions, used to build endurance and burn fat,” making them optimal for improving cardio fitness without overexertion (Wong, 2022). Zone 2 is a relatively low training intensity at roughly 60-70% of your max heart rate, carrying benefits including low injury risk and faster recovery as it is less taxing on muscle damage (Gesell, 2023).
Moderate training is reserved for Zone 3 which falls between 70-80% of your max heart rate, effective at helping your body adapt to goal pace workouts or tempo runs (Brooks, 2023). However, running harder does not necessarily correlate to better running performance in terms of VO2 max, ie. maximal oxygen uptake, and running economy, ie. oxygen demand of running (Azevedo, 2023). This begs the question, does running Zone 2 yield higher aerobic efficiency than running in Zone 3?
Although Zone 2 runs are lower intensity, one must sustain said pace for a longer period to complete the same distance at a Zone 3 pace, which may affect aerobic consumption. Frequently used as a “fat-burning” stage, Zone 2 runs use a significant amount of fat as an energy source when running at low intensities (Weber, 2023). Due to the additional oxygen consumption, the body’s aerobic efficiency may be impacted. On the other hand, Zone 3 relies more on carbohydrates as a fuel source and is more balanced in anaerobic and aerobic energy contributions (Makarov, 2024). These factors may contribute to the body’s aerobic efficiency when running at each heart rate zone.
To measure an individual’s maximum oxygen capacities, VO2 max should be considered. For the past century, VO2 max, or an individual’s maximal oxygen intake has been associated with running performance (Borgen, 2017). However, more recent research suggests that the relationship between VO2 max and performance may have mixed interpretations (Borgen, 2017). It was found that in a sample of sedentary individuals, improvements in VO2 max did not contribute to improvements in running performance (Vollaard et al., 2009). Similar results were concluded for well-trained runners in another study, in which a relationship between improvements in VO2 max and running performance was unable to be found (Legaz Arrese et al., 2005).
Another important method of measuring aerobic efficiency is running economy, defined as the amount of oxygen the body uses to run 1 km per kg of bodyweight, measured in mL O2/kg/km (Van Megen & Van Dijk, 2016). An athlete with a low running economy value means their body uses less oxygen to run at a given pace, and therefore has a better running economy. Achieving a low running economy paired with a high VO2 max is ideal for endurance athletes (Borgen, 2017). For example, a runner with a running economy of 180 mL O2/kg/km uses less oxygen when running at the same pace compared to another runner with a running economy value of 213 mL O2/kg/km. The first runner’s body has higher aerobic efficiency. This study aims to investigate running economy at different heart rates when running at paces in Zone 2 compared to paces in Zone 3.
Materials and Methods
A single East Asian male participant of age 17 years old with beginner/intermediate running experience was involved in this study. For this experiment, equipment the participant used included a treadmill, running shoes, and an Apple Watch Series 3 that was pre-calibrated with their existing body measurements and running history. The participant was required to have a predicted VO2 max Apple Watch reading and provide basic health details including age and body mass. For Apple Watch to estimate a VO2 max reading, the user must wear it for at least 24 hours and track several outdoor walks, outdoor runs, or hiking workouts (Apple Support, 2024). Additionally, participants submitted their max heart rate (MHR) and resting heart rate (RHR) from their Apple Watch Health data. If no data was available, the participant was instructed to calculate their MHR using Eq. 1:

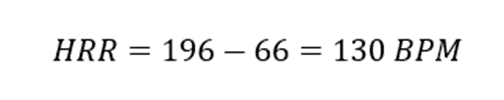
Manual measurement of RHR could be accomplished by placing two fingers on the radial artery on the wrist or the carotid artery on the neck and counting the number of beats for 60 seconds upon waking up (Davidson, 2022). The preliminary max and resting heart rate data was used to calculate the participant’s heart rate reserve (HRR) using Eq. 2 (Davidson, 2022):

To calculate the participant’s heart rate zones, the target heart rate (THR), ie. the ideal beats per minute for exercising at a given intensity, was used to find the lower and upper limits of each zone (Brooks, 2023). This is a modified calculation of heart rate zones is called the Karvonen method, which factors both age and resting heart rate into account. For Zone 2, the THRs are calculated by multiplying HRR by the lower and upper limits of Zone 2 (60% and 70%). Then, the RHR is added to the lower limit and the RHR minus one is added to the upper limit. The one is subtracted from the RHR when calculating the upper limit of Zone 2 because adding only the RHR will start the lower limit of Zone 3. To calculate the THRs for Zone 3, the steps were repeated but using 70% and 80% for the lower and upper limits instead. See Eq. 3 and Eq. 4 for Zone 2 and Zone 3 heart rate range calculations, respectively.

During Runs
Using these target heart rates, the participant performed a test run on a treadmill to identify a suitable pace range for each zone using their Apple Watch heart rate reading. On the Apple Watch Fitness app, the participant was instructed to press the three dots on “Indoor Run” and select 1000 m for distance to begin tracking their treadmill run. Running at the pace tested previously, the participant ran for 1 km nonstop while maintaining a consistent cadence as per the Apple Watch time reading, not the treadmill. Afterwards, the participant would check the run on their iPhone Fitness app and verify if heart rate was tracked for the entire duration of the workout in the “Splits” section. Post-confirmation, the following Apple Watch/iPhone Fitness app run data was recorded and submitted via a Google Forms:
Date of run, heart rate Zone (2 or 3), treadmill pace (miles per hour, MPH), watch pace (min/km), watch average workout heart rate (beats per minute, BPM), watch mode heart rate (BPM), and watch average cadence (steps per minute, STM), and watch workout time.
The mode heart rate was estimated by selecting “Show More” on the Workout Details section and sliding a finger along the Heart Rate graph and identifying the approximate heart rate that occurs the most. The participant repeated all the steps for ten Zone 2 runs followed by nine Zone 3 runs with a 48-hour recovery window between runs.
Post-Run Calculations
After all participant running data was submitted on the Google Forms, an Excel spreadsheet was compiled with each run separated by row. The running economy of each run was calculated using Eq. 5.

The velocity in km/min was converted from mins/km by taking the reciprocal of the watch pace value. In Eq. 6, the workout VO2 is calculated by multiplying VO2 max by the ratio of their heart rate during the run to their MHR, as there is evidence of a linear relationship between VO2 and heart rate (Schantz et al., 2019).

Statistical Analysis
After all data was collected, the runs were organized by zone and plotted on two separate graphs comparing the relationship between each independent variable (pace and heart rate) with the dependent variable (running economy): (1) pace versus running economy and (2) mode heart rate versus running economy. A linear regression line for each graph was produced, as well as their respective linear regression equations to predict running economy based on arbitrary values of each independent variable. Further data analysis was conducted by calculating the correlation coefficient and r-squared values between the variables for each zone. These values were compared between Zone 2 and Zone 3 to see if there was a difference based on heart rate zone.
Results
The participant’s MHR was 196 BPM and RHR was 66 BPM, so their HRR was calculated to be 130 BPM using Eq. 2.
The participant’s Zone 2 and Zone 3 heart rate ranges were calculated to be [144 – 156 BPM] and [157 – 169 BPM] using Eq. 3 and Eq. 4, respectively.

Table 1: Participant Data
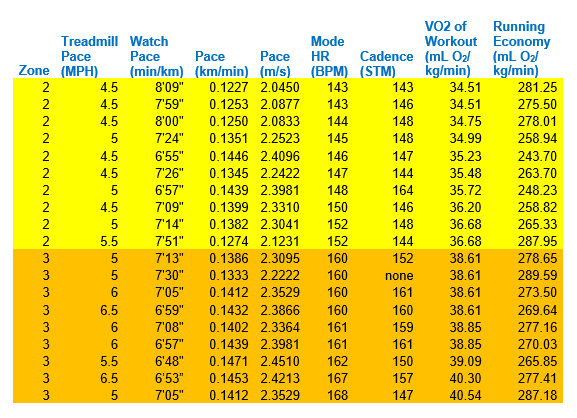
The participant’s 10 Zone 2 runs and 9 Zone 3 runs are summarized in Table 1. The average heart rate based on the mode beats per minute of all the Zone 2 runs was 147 BPM. The average running economy for the Zone 2 runs was approximately 266.14 mL O2/kg/km. Comparatively, the average heart rate based on the mode beats per minute of all the Zone 3 runs was 162.11 BPM. The average running economy for the Zone 3 runs was approximately 276.56 mL O2/kg/km.

Figure 1: Graph of Pace vs Running Economy
There appears to be a strong negative association between the two variables, with correlation coefficients (r-value) of -0.93 and -0.78 for Zone 2 and Zone 3, respectively. The r-squared values for Zone 2 and Zone 3 are approximately 0.86 and 0.60, respectively. This suggests that approximately 86% and 60% of the running economies can be explained by the Zone 2 and Zone 3 linear regression lines, respectively.The linear regression equations for predicting running economy based on each zones’ pace are stated in Eq. 7 and Eq. 8:

The relationship between mode heart rate and running economy was also investigated in Figure 2. The correlation coefficient for the data is 0.41, which is a low-moderate positive association between mode heart rate and running economy. The r-squared value for the data is approximately 0.17, meaning that approximately 17% of the running economies can be explained by the linear regression line. In Eq. 9, the general linear regression equation for predicting running economy based on mode heart rate is:


Figure 2: Graph of Mode Heart Rate vs Running Economy
The relationship between mode heart rate and running economy was compared based on Zone 2 and Zone 3 runs separately in Figure 3. The correlation coefficient for the Zone 2 data is -0.07, which is a very weak negative association between mode heart rate and running economy. The r-squared value for the Zone 2 data is approximately 0.01, meaning that approximately 1% of the running economies can be explained by the regression line. For Zone 3, a greater correlation coefficient of 0.32 is observed, displaying a low positive association between mode heart rate and running economy. The r-squared value for the Zone 3 data is also notably higher at approximately 0.10, meaning that approximately 10% of the running economies can be explained by the regression line. The linear regression equations for predicting running economy based on mode heart rate by zone are stated in Eq. 10 and Eq. 11:


Figure 3: Graph of Zone-based Mode Heart Rate vs Running Economy
Discussion
Pace and Running Economy
In Figure 1, the graph shows that as pace increases, running economy tends to decrease. As velocity increases in the denominator of Eq. 5, the running economy equation, the running economy value should decrease. These findings match with conclusions drawn from previous research which shows that running economy reduces approximately 5% when pace increases from 9 to 12 km/hr for untrained runners (van Megen & van Dijk, 2020). Similar results were found for trained runners, with running economy declining around 7% when pace increases from 11 km/hr to 18 km/hr (van Megen & van Dijk, 2020).
Factors Affecting Running Economy
Figure 1 contains potential outliers at the Zone 2 point (0.1274, 287.95) and Zone 3 point (0.1412, 287.18) which may account for lowering the correlation coefficient and r-squared values for each zone. There were multiple potential outliers that occurred in Figures 2 and 3 including the points (143, 281.25), (146, 243.70), (148, 248.23), (152, 287.95), and (160, 289.59). These potential outliers could be responsible for the extremely low correlation coefficients and r-squared values. The graphs in Figures 2 and 3 show very poor/no correlation between heart rate and running economy. However, there may be confounding variables that interfered with the data collection of the experiment. There are many factors that can affect a person’s running economy, namely (1) body anatomy and physiology, (2) muscle fuel mix, and (3) running form (van Megen & van Dijk, 2016). However, these factors are difficult to control.
- Body Anatomy and Physiology
In terms of body anatomy and physiology, body fat percentage, leg length, calve thickness, feet size, and hip flexibility are thought to affect running economy (van Megen & van Dijk, 2016). Although most of these factors cannot be altered feasibly, reducing body fat percentage is associated with an improved running economy (Venturini & Giallauria, 2022). Over the 10 weeks of this experiment, the participant recorded an approximate weight gain of 8 lb, from 163 lb to 171 lb. Failing to keep the body mass variable controlled may have contributed to variance in running economy. Despite the weight gain, the participant noted that they also participated in weightlifting three days a week and taekwondo once a week, possibly reducing fat gain.
In a nine-week strength training study, researchers found that on top of a 24% and 34% strength gain in the upper and lower body, running economy was reduced by 4%, but did not affect VO2 max (Paavolainen et al., 1999). Moreover, strength training seems to be associated with an improved running economy. However, participation in other physical activity, especially taekwondo, may have led to insufficient recovery from neuromuscular damage as it is a leg and kicking dominant sport. The effect exercise associated lower limb neuromuscular damage has on running economy has not been thoroughly explored and should be investigated in future studies (Bonacci et al., 2009).
Additionally, sleep recovery was noted to be variable, typically ranging from 6-8 hours daily. Depleted energy levels from lack of recovery and sleep could reduce cardiovascular function and muscle recovery, which are responsible for the oxygenation of muscles during aerobic exercise like running (Fry & Rehman, 2021). Therefore, running economy may have been negatively affected.
Internal body temperature may also be an influential factor of running economy, as the participant stated the cold weather outdoors or overheating with excessive clothing layers when walking to the gym could have caused different starting heart rates for the treadmill runs. The positive of running on treadmills was that the temperature indoors would be held constant even with variable temperatures outdoors when commuting to the fitness center.
Since the experiment took place over 10 weeks with consistent training throughout the experiment, improving running performance overtime is possible. As 19 runs were recorded, at least 19 km were completed at varying intensities. Running economy may have also improved throughout the experiment, as the body increases its efficiency at using oxygen during aerobic exercise if running performance improves (Averill, 2015).
2. Muscle Fuel Mixture
The participant’s weightlifting workouts involved high intensity training, typically burning between 300-500 calories per 1-1.5 hour session. To refuel from burning these calories, the participant’s diet comes into play – another potential factor affecting running economy. The participant shared that their diet varied daily, consuming different amounts of carbohydrates and fats which affects their muscle fuel mixture (van Megen & van Dijk, 2016). Eating a carb-rich diet such as bread and pasta contains high concentrations of glucose which can be instantly used as fuel or stored as glycogen in the liver and muscles (Eberle, 2021). Especially when increasing exercise intensity, glucose is the muscles’ primary fuel source (Eberle, 2021). For Zone 3 running, carbohydrates are crucial because they are highly efficient as they require less oxygen to burn than protein or fat (Eberle, 2021). Due to the lower oxygen demand, improved running economy may be exhibited with carb-rich diets when running at moderate intensities like Zone 3.
In a three-week training program, elite runners consumed a low-carb, high-fat diet which although increased VO2 max, adversely affected performance due to its negative affect on running economy (Venturini & Giallauria, 2022). Zone 2 running relies more on fats as an energy source on top of carbohydrates (Weber, 2023). Fats account for 50% or more of the muscle fuel mix in light to moderate physical activity at 65% of max aerobic capacity or below (Eberle, 2021). Despite fats providing more than double the energy that carbohydrates contain, they also take more oxygen to burn, as they must undergo beta-oxidation, a metabolic pathway that turns fat into fuel (Weber, 2023). This means that fats require more energy to burn, potentially decreasing the aerobic efficiency of the muscles and negatively affecting running economy.
Hence, because whether the participant was carb-loading or eating fat-dense foods around the time of the runs is unknown, the impact diet had on muscle fuel mixture and running economy cannot be determined.
3. Running Form
Another factor that may have influenced the running economy is running form. While most runs in Zone 2 were between 140-150 SPM and between 150-160 SPM for Zone 3, there were some outliers detected, for example, 164 STM for a 5 MPH Zone 2 run. A “good running form” is associated with little ground contact time and high cadence (van Megen & van Dijk, 2016). Hence, that one deviation may have resulted in an improved running economy value, interfering with the overall trend of the data.
The participant also stated that they switched shoes near the second half of the experiment from Nike Air Force 1 sneakers to Adidas Ultraboost 1.0 runners. The main difference between the shoes is the sole, as the participant described the Air Force 1s having a hard and heavy sole, whereas that of the Ultraboosts felt light and cushioned. It was noted that the participant experienced foot discomfort when running with the Air Force 1s, possibly resulting in poor running form when compared to running with Ultraboosts which was said to be more comfortable to run in. This disparity between shoe types may have contributed to variability in running economy, especially near the latter runs of the experiment.
Running in different shoe types can influence running form. A well-fitted shoe is typically conducive to a more efficient running style, while also mitigating injury risk and lead to better running performance (Syte, 2023). Cushioned shoes not only provide additional comfort, but can also help with feet alignment, more even body weight distribution, and more efficient strides (Syte, 2023). As well, many studies have investigated the effect of footwear on running economy. A meta-analysis of 14 studies concluded that lighter shoes and running barefoot had a small, yet significant improvement on running economy compared to heavier or more conventional footwear options (Fuller et al., 2014). Shoes with a combined shoe mass under 440 g were found to have no severe effect on running economy (Fuller et al., 2014). The Ultraboosts weighed in at 320 g, whereas the Air Force 1s weighed in at 515 grams.
Technology and Data Collection
Although the Apple Watch tracked running data including heart rate and pace, the heart rate sensor decreases in accuracy with increasing workout intensity (Khushhal et al., 2017). Heart rate accuracy at low intensity Zone 2 runs should have little error from the authentic heart rate, but more intense Zone 3 runs could have been affected with more error (Khushhal et al., 2017). Consequently, the participant noted that their heart rate at the beginning of the run would occasionally spike in the first 1-2 minutes from a low starting heart rate, stay relatively constant mid-run, and gradually increase near the end of the run. To reduce the potential skewing of heart rate data, the mode heart rate of each run was taken instead of the average to avoid the beginning and end readings from interfering.
Additionally, the Apple Watch may not have predicted a precise VO2 max reading, as testing maximal oxygen consumption typically requires sophisticated lab equipment such as oxygen masks (Murphy, 2015). Because VO2 is a proportion of the participant’s VO2 max, an inaccurate VO2 max could skew the calculations of those values (Schantz et al., 2019). However, the participant used the same Apple Watch throughout the experiment and keeping that constant would ensure that all the data is standardized even if the VO2 max is wrong.
Future Experimentation
Due to limited time and resources, finding suitable participants for this study was a challenge. Conclusions drawn from this study may not be entirely accurate to the general population because of the small sample size. A future study can be to repeat this experiment but increase the number of subjects by randomly selecting participants of various ages and running experience levels.
This experiment can be further extended to investigate the impact that cross-training has on running economy with respect to different age groups. As mentioned before, a major confounding factor that may have affected running economy for the participant was their involvement in weightlifting and taekwondo during the experiment. While previous research has studied the relationship between cross-training and running economy, age is not always kept constant. A young adolescent and middle-aged person may recover at different rates, which could be analyzed to determine the effect of age on running economy after cross-training. This would allow researchers to understand how engaging in other physical activity influences runners of different ages and how they respond aerobically. Athletes would gain valuable insights on how to optimally structure a running program combined with other exercises to prevent over-exhaustion or injury caused by poor aerobic performance.
References
Averill, A. (2015, October 2). Aerobic Efficiency Explained. SportTracks. https://sporttracks.mobi/blog/aerobic-efficiency-explained
Azevedo, J. (2023, April 17). Why training harder may not make you faster (A new approach to running). Thepaseoclub.com. https://www.thepaseoclub.com/blog/why-training-harder-may-not-make-you-faster-new-apprach-running
Bonacci, J., Chapman, A., Blanch, P., & Vicenzino, B. (2009). Neuromuscular Adaptations to Training, Injury and Passive Interventions. Sports Medicine, 39(11), 903–921. https://doi.org/10.2165/11317850-000000000-00000
Borgen, N. T. (2017). Running performance, VO2 max, and running economy: The widespread issue of endogenous selection bias. Sports Medicine, 48(5), 1049–1058. https://doi.org/10.1007/s40279-017-0789-9
Brooks, A. (2023, December 2). Zone 2 Heart Rate Training Explained | How and Why It Matters. RunToTheFinish. https://www.runtothefinish.com/zone-2-heart-rate-training/
Davidson, K. (2022, March). Heart Rate Reserve: What It Is and How to Use It. Healthline; Healthline Media. https://www.healthline.com/health/fitness/what-is-heart-rate-reserve#how-to-calculate-it
Eberle, S. G. (2021, March 30). The Body’s Fuel Sources. Human Kinetics. https://us.humankinetics.com/blogs/excerpt/the-bodys-fuel-sources
Fry, A., & Rehman, A. (2021, January 23). Sleep, Athletic Performance, and Recovery. Sleep Foundation. https://www.sleepfoundation.org/physical-activity/athletic-performance-and-sleep
Fuller, J. T., Bellenger, C. R., Thewlis, D., Tsiros, M. D., & Buckley, J. D. (2014). The Effect of Footwear on Running Performance and Running Economy in Distance Runners. Sports Medicine, 45(3), 411–422. https://doi.org/10.1007/s40279-014-0283-6
Gesell, T. (2023, January 4). Beginner’s guide to Zone 2 running. 220triathlon.com; 220 Triathlon. https://www.220triathlon.com/training/run-training/beginners-guide-to-zone-2-running
Khushhal, A., Nichols, S. J., Evans, W. J., Gleadall-Siddall, D., Page, R., O’Doherty, A. F., Carroll, S., Ingle, L., & Abt, G. (2017). Validity and Reliability of the Apple Watch for Measuring Heart Rate During Exercise. Sports Medicine International Open, 1(06), E206–E211. https://doi.org/10.1055/s-0043-120195
Legaz Arrese, A., Serrano Ostáriz, E., Jcasajús Mallén, J. A., & Munguía Izquierdo, D. (2005). The changes in running performance and maximal oxygen uptake after long-term training in elite athletes. The Journal of Sports Medicine and Physical Fitness, 45(4). https://pubmed.ncbi.nlm.nih.gov/16446673/
Makarov, I. (2024, February 6). Zone 3 Training: Sweet Spot or Grey Zone? INSCYD; INSCYD. https://inscyd.com/article/zone3-training/
Murphy, S. (2015, June 6). Here’s how to take your own VO2-max test. Runner’s World; Runner’s World. https://www.runnersworld.com/uk/training/a773454/take-your-own-vo2-max-test/
Paavolainen, L., Keijo Häkkinen, Ismo Hämäläinen, Ari Nummela, & Rusko, H. (1999). Explosive-strength training improves 5-km running time by improving running economy and muscle power. Journal of Applied Physiology, 86(5), 1527–1533. https://doi.org/10.1152/jappl.1999.86.5.1527
Schantz, P., Salier Eriksson, J., & Rosdahl, H. (2019). The heart rate method for estimating oxygen uptake: Analyses of reproducibility using a range of heart rates from cycle commuting. PLOS ONE, 14(7), e0219741. https://doi.org/10.1371/journal.pone.0219741
Syte, A. (2023, May 18). The Impact Of Running Shoes On Running Form And Performance. The Athlete’s Foot; The Athlete’s Foot. https://theathletesfoot.co.za/blogs/athletes-corner/the-impact-of-running-shoes-on-running-form-and-performance#:~:text=Running%20shoes%20can%20aid%20in,a%20healthier%2C%20more%20efficient%20stride.
Track your cardio fitness levels – Apple Support (CA). (2024, February 15). Apple Support. https://support.apple.com/en-ca/108790
Weber, S. (2023, April 5). The Ultimate Guide to Running Economy: How to Improve and Measure It. INSCYD; INSCYD. https://inscyd.com/article/running-economy/
van Megen, R., & van Dijk, H. (2020). 25. The impact of speed on the running economy (ECOR and RE). https://hetgeheimvanhardlopen.nl/wp-content/uploads/2020/10/25.-The-impact-of-speed-on-the-running-economy-ECOR-and-RE.docx.pdf
van Megen, R., & van Dijk, H. (2016). 6. Measuring and improving your Running Economy! https://hetgeheimvanhardlopen.nl/wp-content/uploads/2016/10/6.-Measuring-and-improving-your-running-economy.pdf
Venturini, E., & Giallauria, F. (2022). Factors Influencing Running Performance During a Marathon: Breaking the 2-h Barrier. Frontiers in Cardiovascular Medicine, 9. https://doi.org/10.3389/fcvm.2022.856875
Vollaard, N. B., Constantin-Teodosiu, D., Fredriksson, K., Rooyackers, O. E., Jansson, E., Greenhaff, P. L., Timmons, J. A., & Sundberg, C. J. (2009). Systematic analysis of adaptations in aerobic capacity and submaximal energy metabolism provides a unique insight into determinants of human aerobic performance. Journal of Applied Physiology (1985, Online), 106(5), 1479–1486. https://doi.org/10.1152/japplphysiol.91453.2008
Wong, E. (2022, May 19). Understanding heart rate zones. The GoodLife Fitness Blog. https://blog.goodlifefitness.com/article/understanding-heart-rate-zones