Alejandro Senties Gutierrez- Year 3
Abstract
The advent of unmanned aerial vehicles (UAVs) has unlocked a new realm of innovative possibility in a majority of sectors. Projected growth rates are positive as applications of UAV systems become more versatile. The advancement of UAVs is enabled in no small part by increasingly-accessible computer-aided design (CAD), computational fluid dynamics (CFD) and additive manufacturing tools. This paper presents the conceptual segment of the design procedure for a small-scale, electric UAV. Moreover, iterative optimization via CFD analysis provides a useful means of enhancing performance from the baseline design.
Introduction
As the pace of innovation accelerates in the current epoch, increasingly powerful and cost-effective manufacturing technologies are emerging (Altiparmak & Xiao). Unmanned aerial vehicles (UAVs) can grow notably more advanced as a consequence, prompting the aerospace sector to undergo a shift towards the widespread adoption of UAVs to optimize operations (Cornell et al.; Gupta et al.). Applications for UAVs can be found in many fields, including but not limited to logistics, construction, infrastructure, agriculture, law enforcement and military. These vehicles can enhance process throughput and operational efficiency by eliminating the tedium of routine tasks, increasing safety for human operators in particular cases (Mohsan et al.). The UAV-assisted logistics and transportation market is projected to grow to 11 billion dollars by 2026, roughly doubling from 2019 (Gupta et al.). UAV development is enabled by computer-aided design (CAD) tools used to produce the model geometry and test assembly and computational fluid dynamics (CFD) tools to validate the merit of aerodynamic properties that the model comprises. Furthermore, additive manufacturing technologies can be used for rapid prototyping of model components, or even production of final parts.
This paper aims to use CFD analysis to optimize the aerodynamic performance of a fixed-wing, electric UAV design. The design is constrained so that it can be manufactured by a consumer-grade 3D printer and plastic filament. This paper’s sections follow the chronological order of the design process. The first section outlines the aerodynamic principles applied as the basis of the fundamental design, and its subsections include further detail on each consideration. The second details the CFD-aided optimization on both a holistic and component level. Its corresponding subsections describe the optimization procedure for each given item of focus. Software used includes Onshape 1.181 for cloud-based CAD, SimScale for cloud-based CFD and Ultimaker Cura 5.7.2 for part slicing. The fused-deposition modelling printer used as a reference for individual part dimension constraints is the Prusa i3 MK3S.
Materials and Methods
Fundamental Design
Design Criteria & Constraints
The proposed aircraft was designed with emphasis on three key parameters. These were efficiency at high cruise speeds, stability, and manufacturability. The aircraft’s means of propulsion, a 70 mm electric ducted fan, is rated to produce 26.0 N of static thrust. The aircraft was to maintain a 1:1 thrust-to-weight ratio, and have a 1.25 kg payload capacity. As dictated by the two criteria, the maximum allowable aircraft mass was 1.40 kg. Given the desire for ease of transportation and the size of the reference 3D printer, the target wingspan excluding wingtip devices was to be approximately 1500 mm.
Stability can be bifurcated into static and dynamic stability. Static stability describes the ability of an aircraft to return to level flight upon the removal of a disturbance to its equilibrium. Dynamic stability refers to the attenuation, or amplification, of oscillations as the aircraft returns to equilibrium (Nelson). For the present aircraft, static stability was the primary focus. Beyond stability while in flight, the aircraft had to exhibit favourable stall characteristics which facilitated recovery and preserved maneuverability upon the initial onset of stall.
Efficiency was the second consideration, which can be encapsulated by the aircraft’s lift to drag (L/D) ratio. Emphasis was placed in optimizing aircraft parts for efficient operation at an airspeed greater than or equal to 25 m/s. Additionally, an initial angle of incidence of 3º was added to the wing to allow for flight at a level attitude while at cruise speed.
The final criterion was ease of manufacturing. The proposed aircraft design was constrained by the 210x210x250 mm print volume of a Prusa i3 MK3S. Therefore, airframe parts whose size exceeded the volume dimensions had to be segmented, and assembly elements incorporated into their design.
For the purpose of balancing the airframe’s moments, a material candidate was selected to be able to calculate an approximate mass and center of gravity (C.G). The chosen material was a pre-foamed polylactic acid filament variant (Polymaker Polylite LW-PLA), with a density of 0.8 g/cm3. Ideal for aerospace applications, the light-weight nature of the particular filament yields a density of only 65% that of standard PLA filament (Orellana Barrasa et al.).
Aerodynamic Efficiency
There were two primary elements that were efficiency-centered: the wings and the powerplant.
For the wings, the NACA-2412 airfoil was chosen due to its high Cl/Cd ratio. To further enhance efficiency, a moderately-high aspect-ratio tapered wing was selected. Higher aspect ratios minimize the length of the wingtip for a given wing area, reducing induced drag. The taper was deemed an additional means of reducing wingtip length without extending the wing beyond the size constraint, achieving the greatest possible efficiency benefit. Additionally, the inclusion of wingtip devices further attenuated wingtip vortices.
Last, a v-tail empennage layout was chosen. A two-surface layout can produce both vertical and horizontal forces like a conventional three-surface elevator-rudder layout, but with a lower wetted area. Hence, the elevator-rudder surfaces are named ruddervators. The drag benefits of a v-tail are at the cost of lessened control authority.
Axis & Stall Stability
For an aircraft to be deemed “stable” it needs to have positive static and dynamic stability in all three axes. To achieve longitudinal static stability, the C.G. must be forward of the center of pressure (C.P.). Such placement allows for recovery in the event of a stall, since the nose of the aircraft would pitch downwards. Consequently, the aircraft can regain sufficient airspeed for flight. However, the distance by which the centers of mass and pressure are separated increases the pitch moment arm, which requires a greater counteracting moment from the tail surfaces. As a consequence, required lift increases, as the wings must generate a lift value that is the sum of the weight of the aircraft and the counteracting tail force. The tail force is dictated by the distance to the wing; the torque equilibrium is equivalent to the wing’s lift force, acting from its C.P., and the downward tail force acting from its C.P. This is seen in Figure 1.

Figure 1. Elements placement for illustration purposes only.
To complement the stall benefits from the nose-heavy airframe, 1º of washout, a twist that reduces the angle of attack (AoA) towards the wingtips, was incorporated into the wings. The washout would influence the origin of a stall to commence at the wing roots. In the onset of a stall, ailerons would maintain roll control authority for longer. That characteristic is of particular significance in a stall scenario occurring close to the ground, as it could prevent a wing strike during an inadequate take-off or landing, for instance.
In addition, plain flaps were included in the design to reduce the stall speed, and, therefore, the likelihood of stall during take-off or landing. Flaps increase the camber of the airfoil, producing more lift for a given angle of attack. However, past a certain deployment angle, there are diminishing returns.
For lateral static stability, a 5º dihedral angle was implemented to the wings. Since lift is generated normal to the airfoil surface, a small horizontal component of the total lift force is exerted inward on either side. When a roll disturbance is encountered that renders one wing higher than another, the horizontal component of the lift force is greater on the higher wing. The resultant sideslip causes a sideslip-angle which presents the lower wing at a higher angle of attack to the relative airflow than the upper wing, observed in Figure 2. The result is a restoring moment, seen in Figure 3.
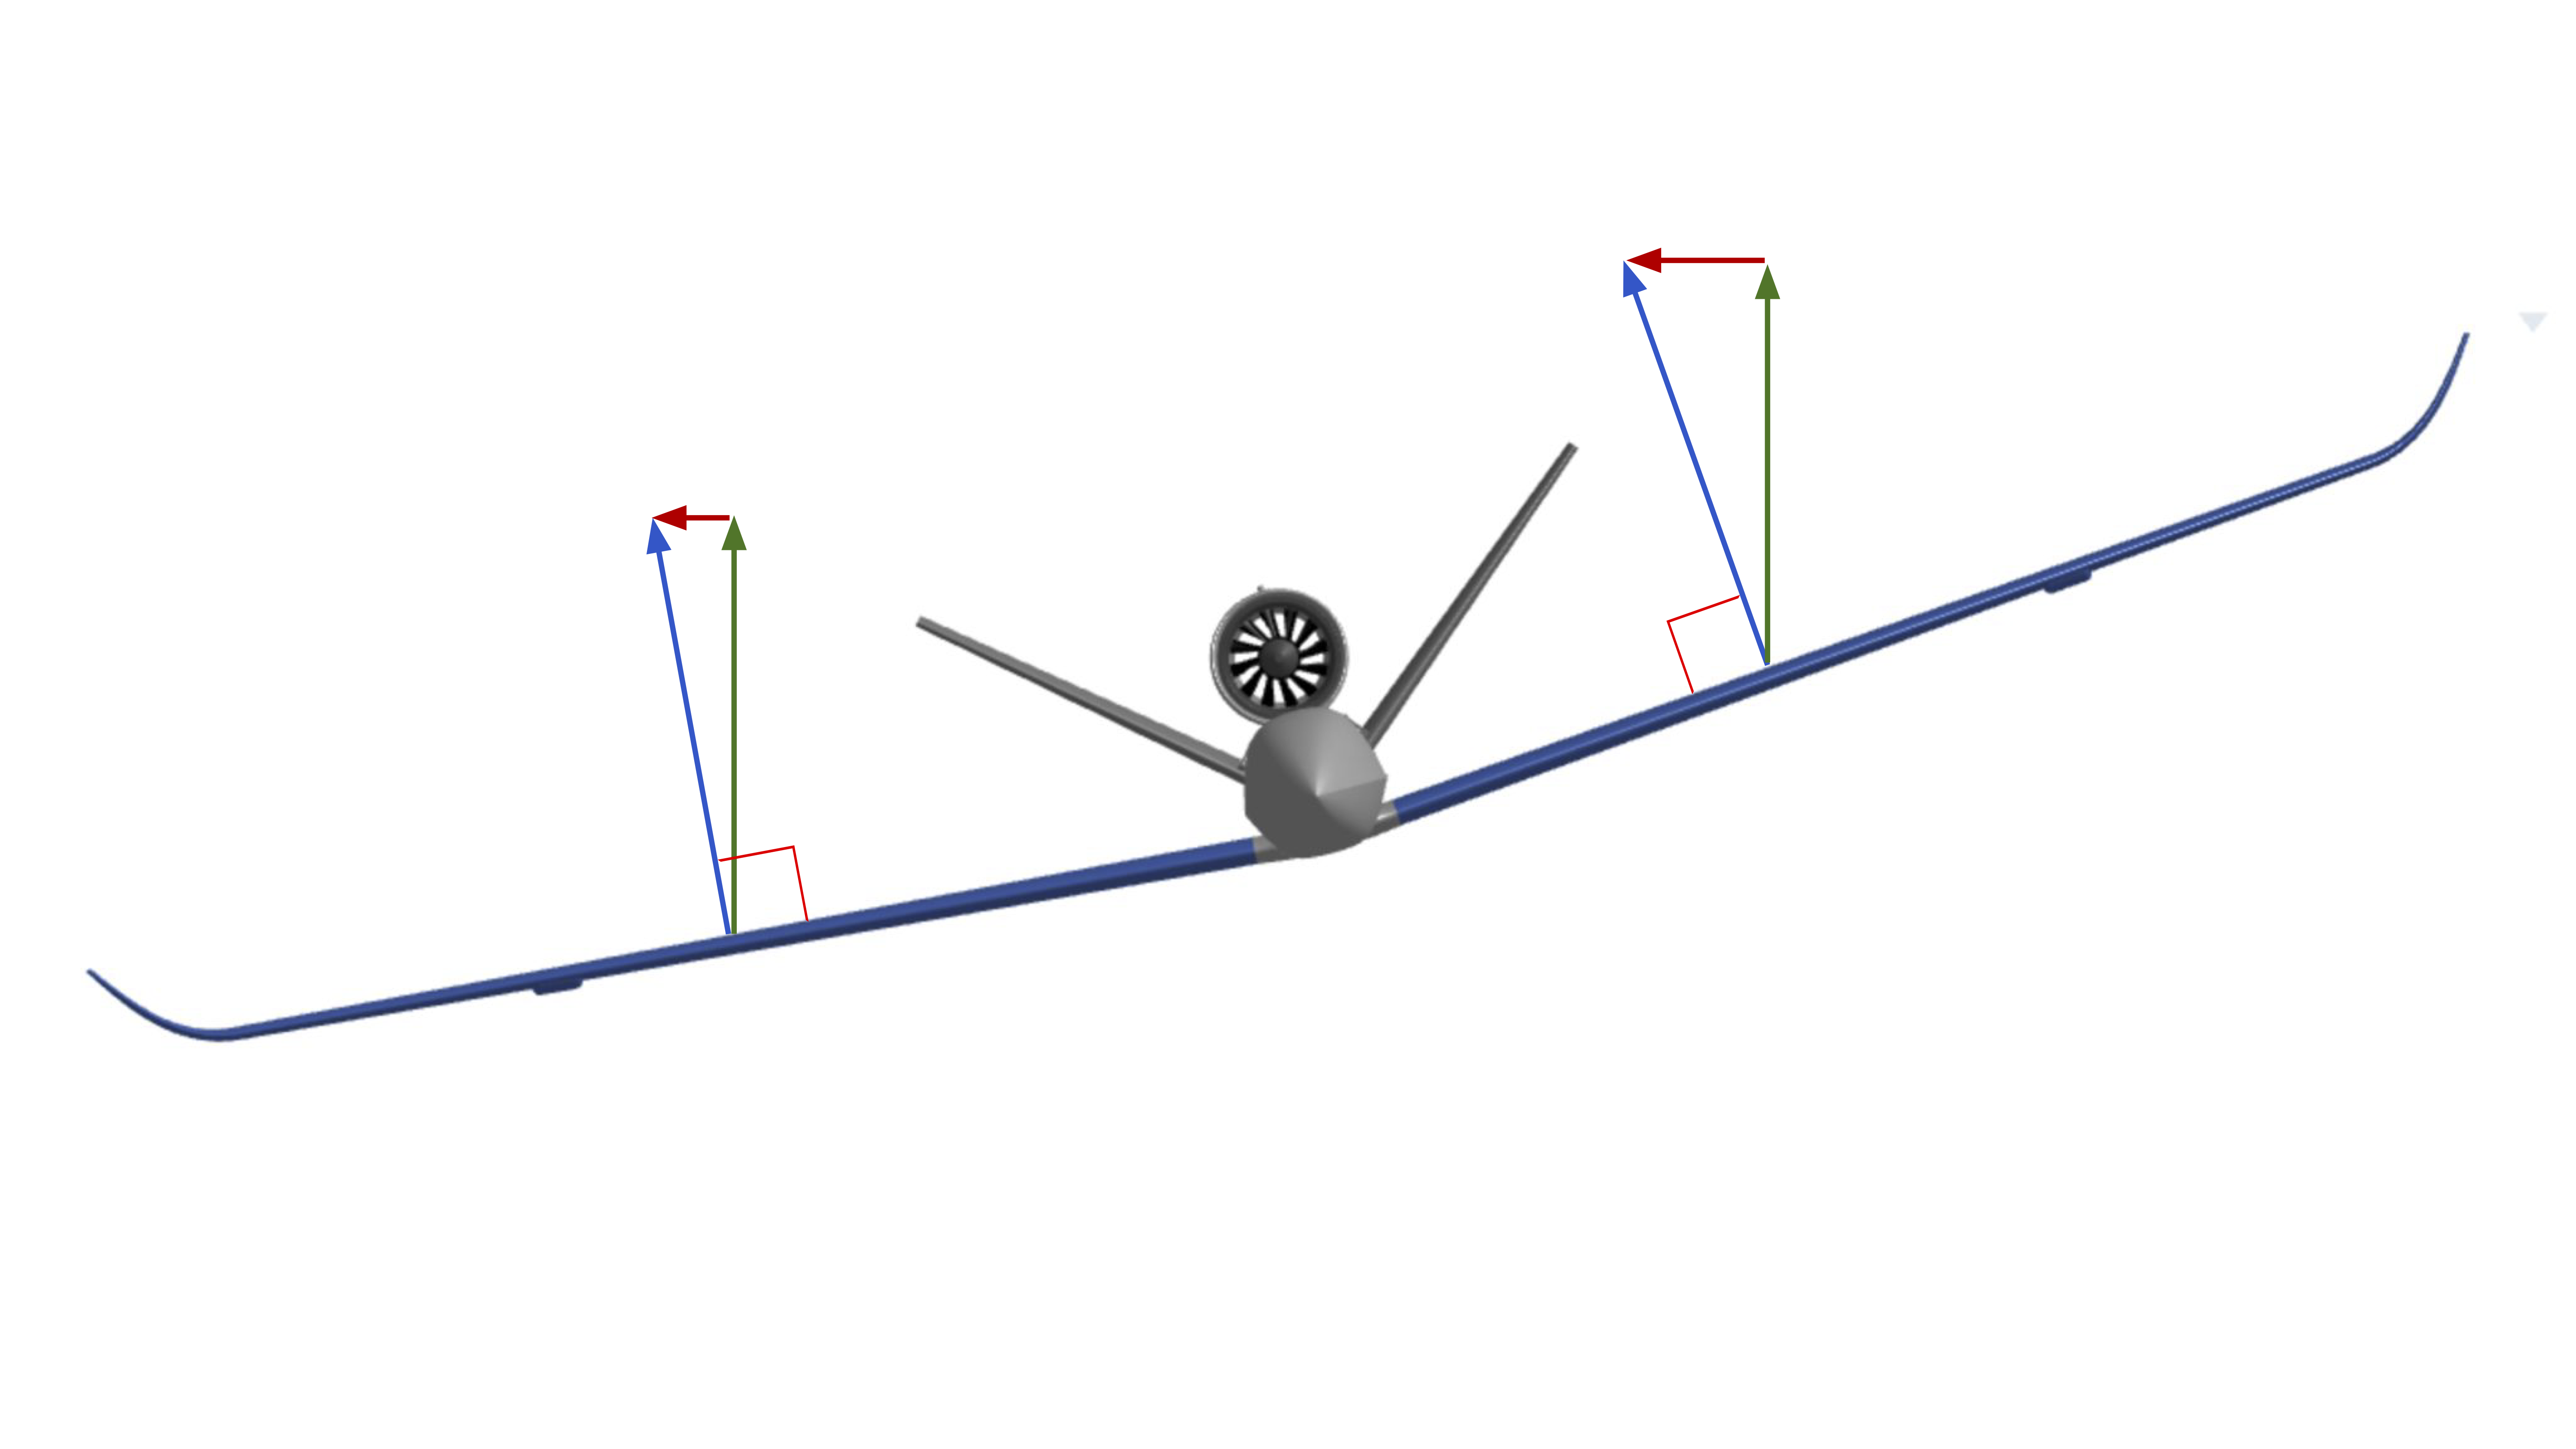
Figure 2. Sideslip condition.
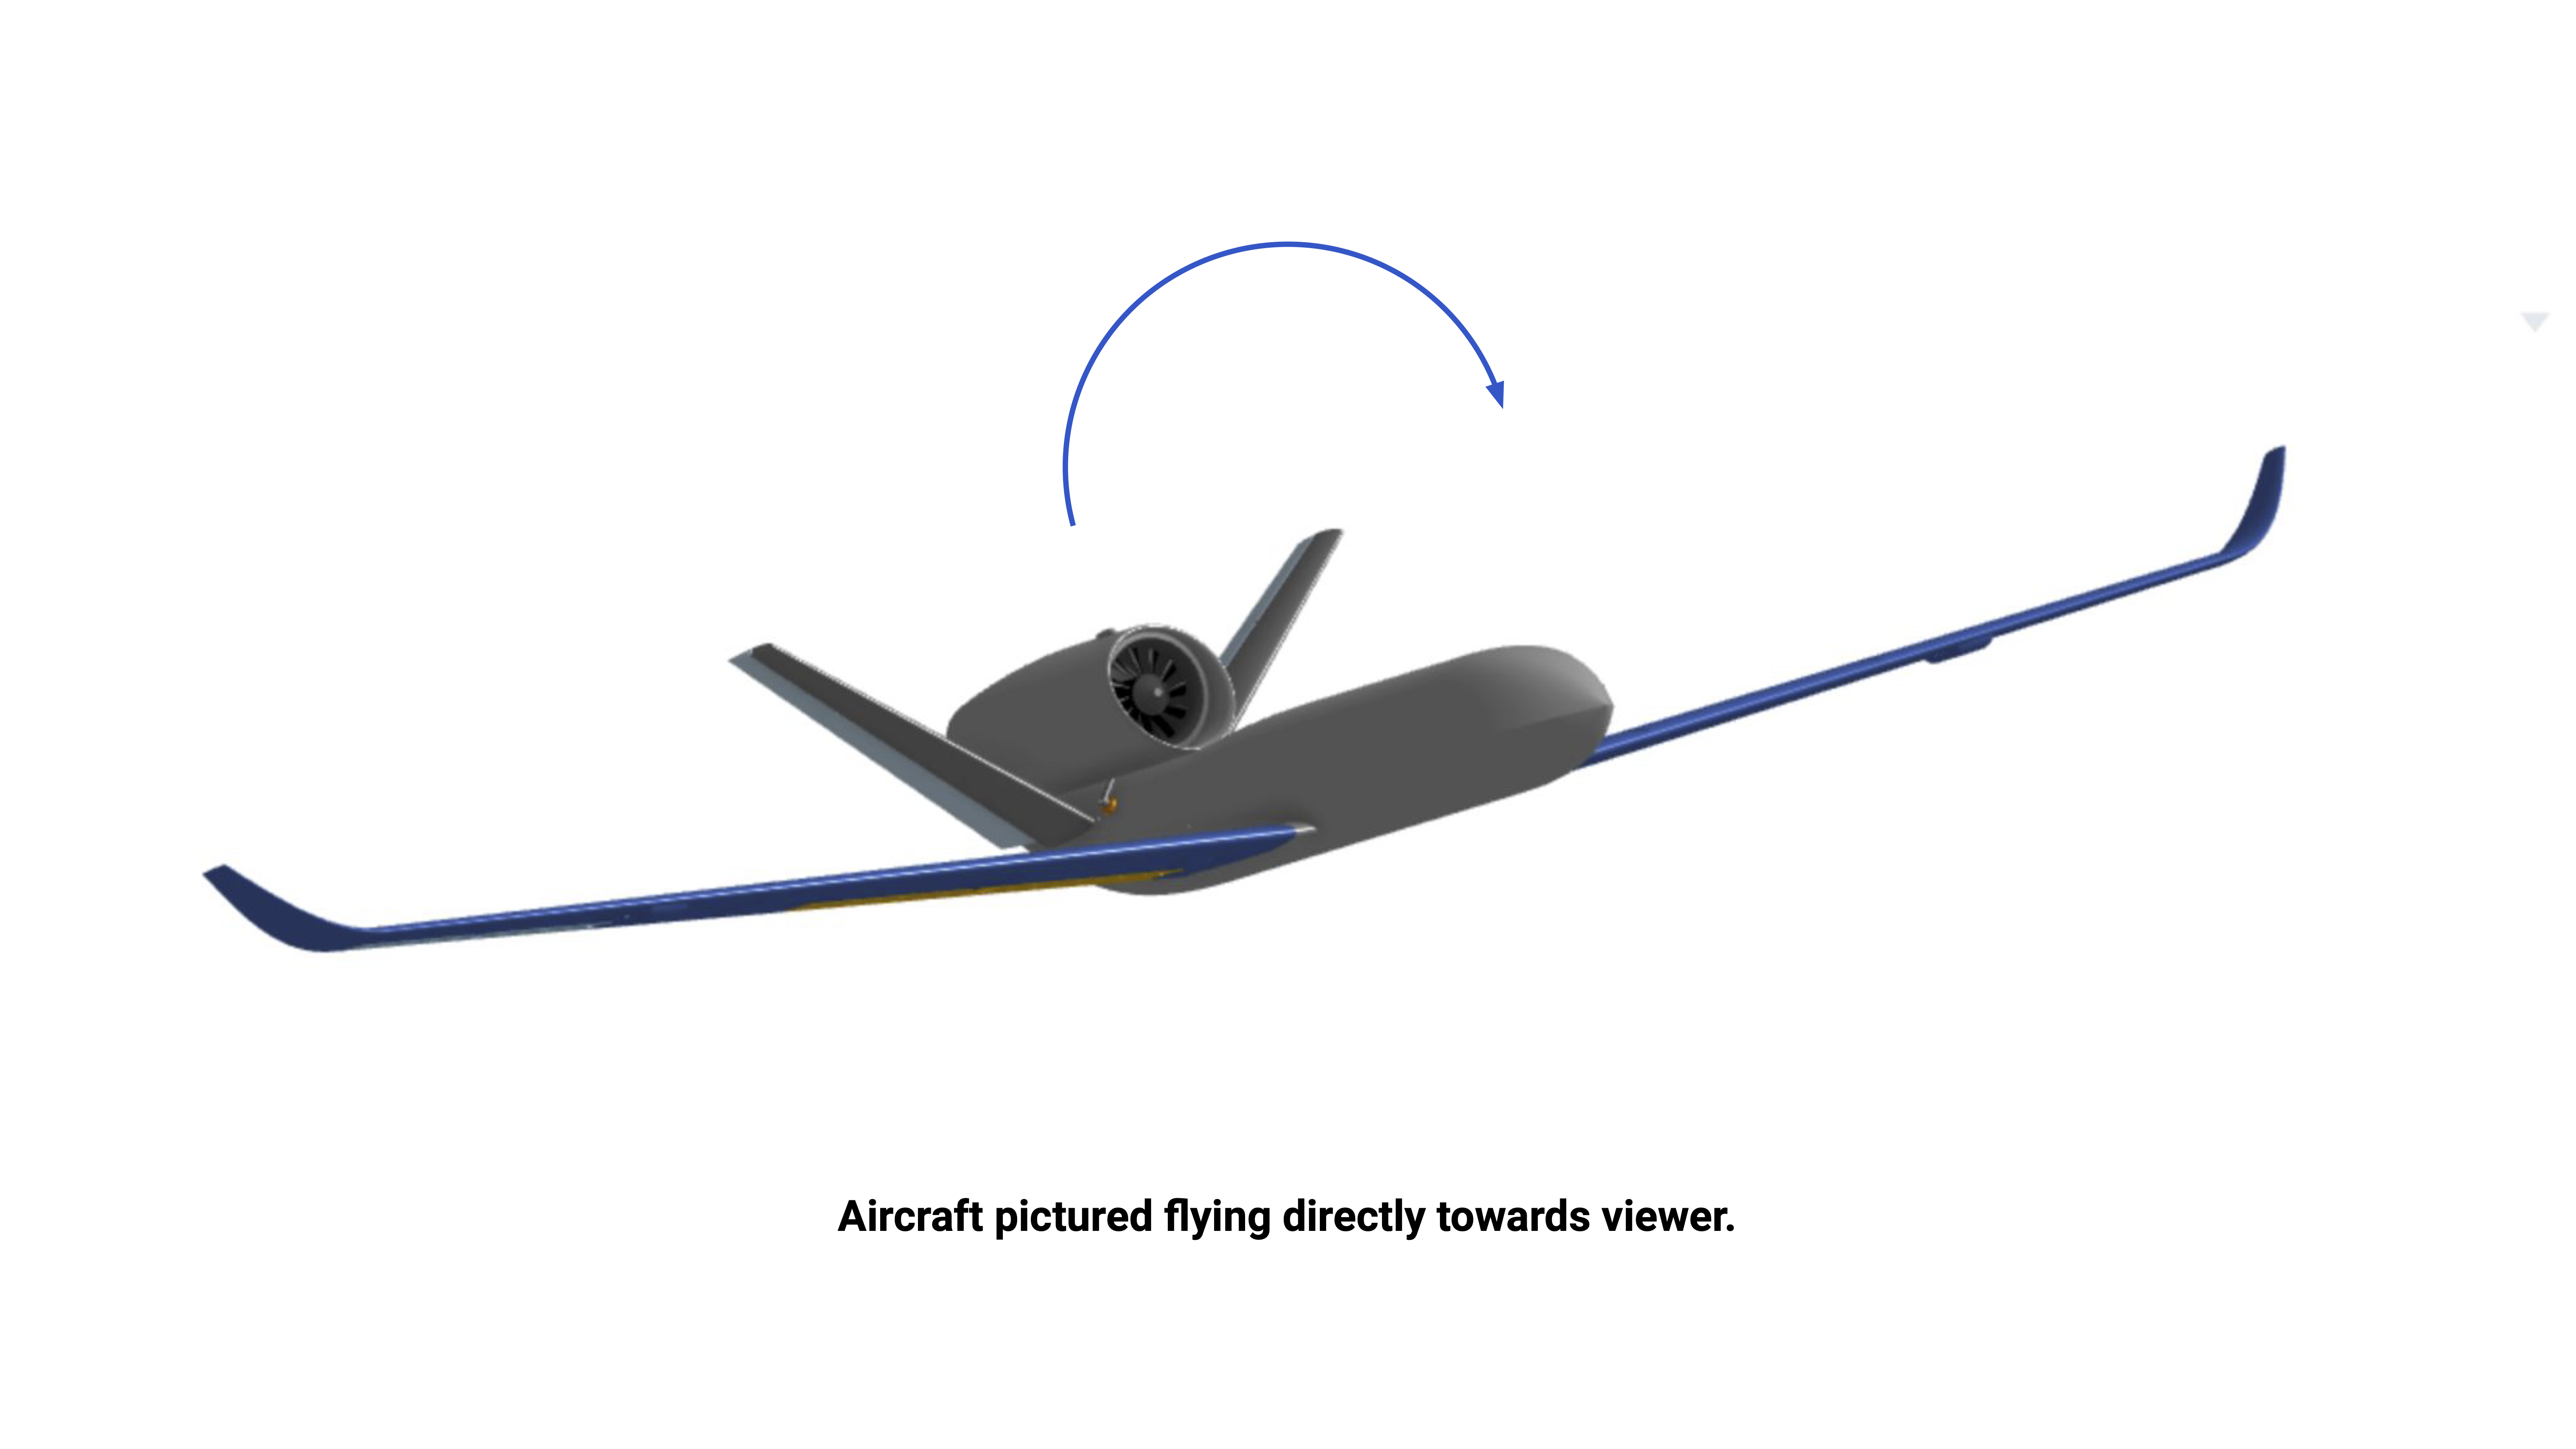
Figure 3. The up-wind wing at a greater angle of attack to the relative wind than the down-wind wing.
Last, to ensure directional static stability, rear pitch and yaw control surfaces were implemented. The rear control surfaces produce greater drag if angled towards the oncoming airflow due to a disturbance, which restores the aircraft to the yaw equilibrium point due to the lateral component of the force produced by the angle of the surfaces.
Aerodynamic Optimization
The SimScale computational fluid dynamics simulation tool was used to analyze and identify the most efficient winglet geometry. It was also used to identify the ideal flap deployment angle and to refine wing placement for ideal control authority and static stability.
All simulations were incompressible and steady-state, performed using a k-omega shear stress transport (SST) turbulence model in a flow domain 5 m long, 2.5 m wide and 5 m high. The air was assigned a density of 1.196 kg/m3 and a kinematic viscosity of 1.529e-5 m2/s. In addition, the leading boundary was a velocity inlet with a value of either 12.5 m/s or 25 m/s depending on the particular simulation, while the trailing boundary was a pressure outlet with a fixed gauge-pressure value of 0. The remaining upper, lower and lateral boundaries were assigned a slip condition.
In isolated wing simulations, for calculating forces, moments and their coefficients, the center of rotation was shifted 45 mm to the side of the wing root to account for the distance of the wing root to the center of the fuselage. This is since the fuselage would lie outside of the simulation domain by the aforementioned amount, but it was desirable for all moments to be calculated around a central origin point, displayed in Figure 4. The reference length and area used were 0.15 m and 0.08 m2 respectively, with the write interval being every 20th time step. Each time step corresponded to one second in the simulation.
Due to computational limitations, simulations were not fully resolved (y+ < 1), but y+ ≈ 5 was maintained, as illustrated in Figure 5.

Figure 4. The CAD origin point for the aircraft.

Figure 5. The y-plus value distribution for the 25º flap-deflection simulation.
To ensure a high-quality mesh without incurring an unviable computational expense, a 1 mm local element size refinement was set for the wing surfaces, as those were the most relevant part of the mesh.
Winglets
The performance of three winglet variants was compared, pictured in Figures 6, 7 & 8.
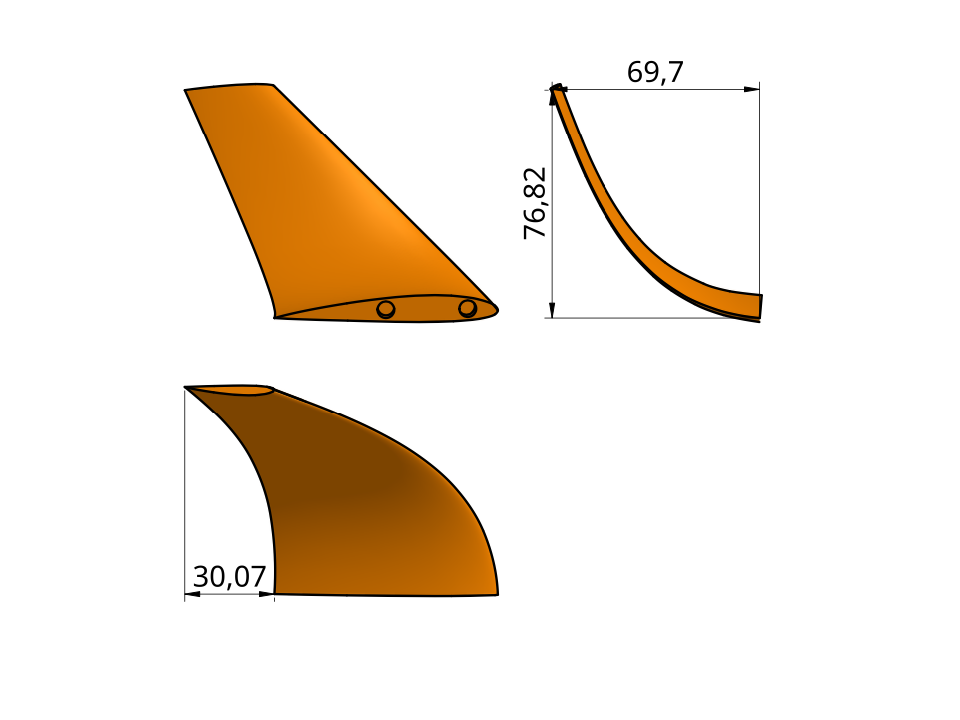
Figure 6. Winglet A; all dimensions in millimeters unless otherwise specified.
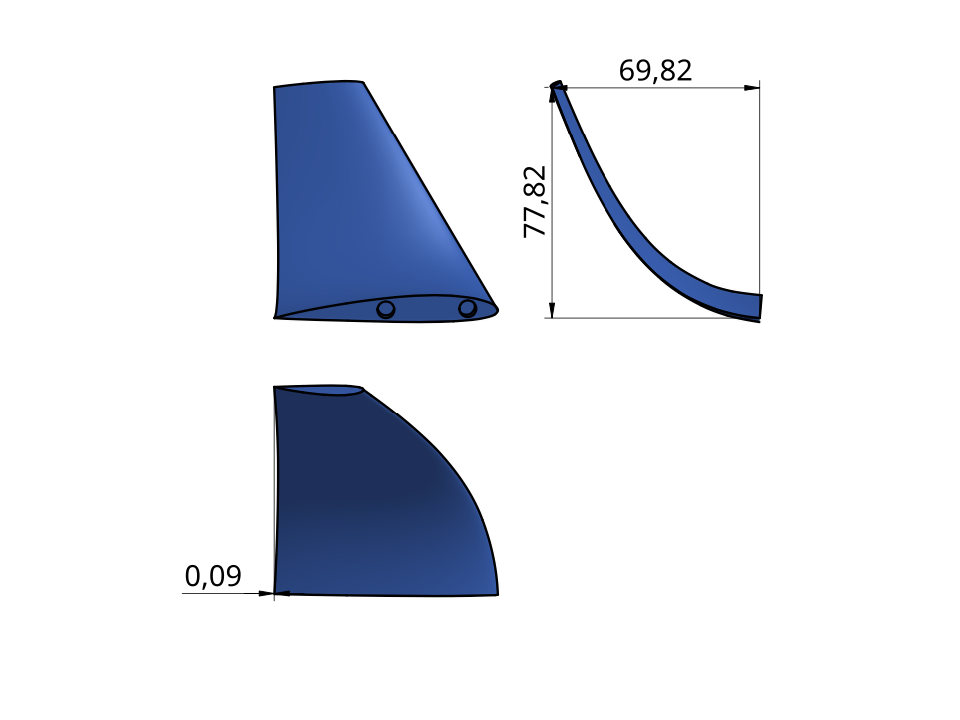
Figure 7. Winglet B.

Figure 8. Winglet C.
The three winglets were subjected to a 12.5 m/s flow velocity, all at a 5º absolute angle of attack; in addition to the 2º angle of incidence due to washout twist at the wingtip, the wing was simulated at a 3º angle of attack. A second round of simulations subjected the wings to a 25 m/s flow velocity at a 2º absolute angle of attack.
Stall Considerations
Trailing-edge flaps were incorporated to reduce stall speed. A total of nine trials were performed on a plain flap, starting from 10º of deflection until 45º by increments of 5º. The final control trial was run with a flap deployment of 0º.
Additionally, a nose-heavy weight distribution was tested to ensure good recoverability in the event of stall without compromising pitch authority. Three simulations were performed at 25 m/s with varying ruddervator deflection angles. The control simulation had 0º of deflection, while the second and third had a 5º and 10º upward deflection, respectively.
General Performance
A holistic analysis of the aircraft was performed to identify the pitching moments and total drag coefficient. To determine the pitching moments, the C.G. of a printed model had to be estimated. With exported Onshape part files, the Ultimaker Cura slicing software generated approximate mass values for all airframe components. A general arrangement of the aircraft is displayed in Figure 9. Print layer height was set to the highest available resolution for the given 3D printer, 0.15 mm. A 2% gyroid infill was selected for all parts, observed in Figure 10. The wall-line count was reduced to a single layer for mass-reduction purposes. As the software provides no decimal places, masses of small components were determined by placing several instances in the print volume and dividing the mass estimate by the number of instances. A final sum of all printed and electronic component masses yielded a value of 1325 g. The center of mass was found to be 27.88 mm forward and 22.74 mm upward of the origin point previously referenced in Figure 4.

Figure 9. Simplified general arrangement drawing of the proposed aircraft.

Figure 10. The Cura slicer software’s “gyroid” infill.
Results
Wings
Winglets
The winglet with the greatest Cl/Cd and lift production at both 12.5 m/s and 25 m/s was candidate C, seen in Figures 11 & 12.
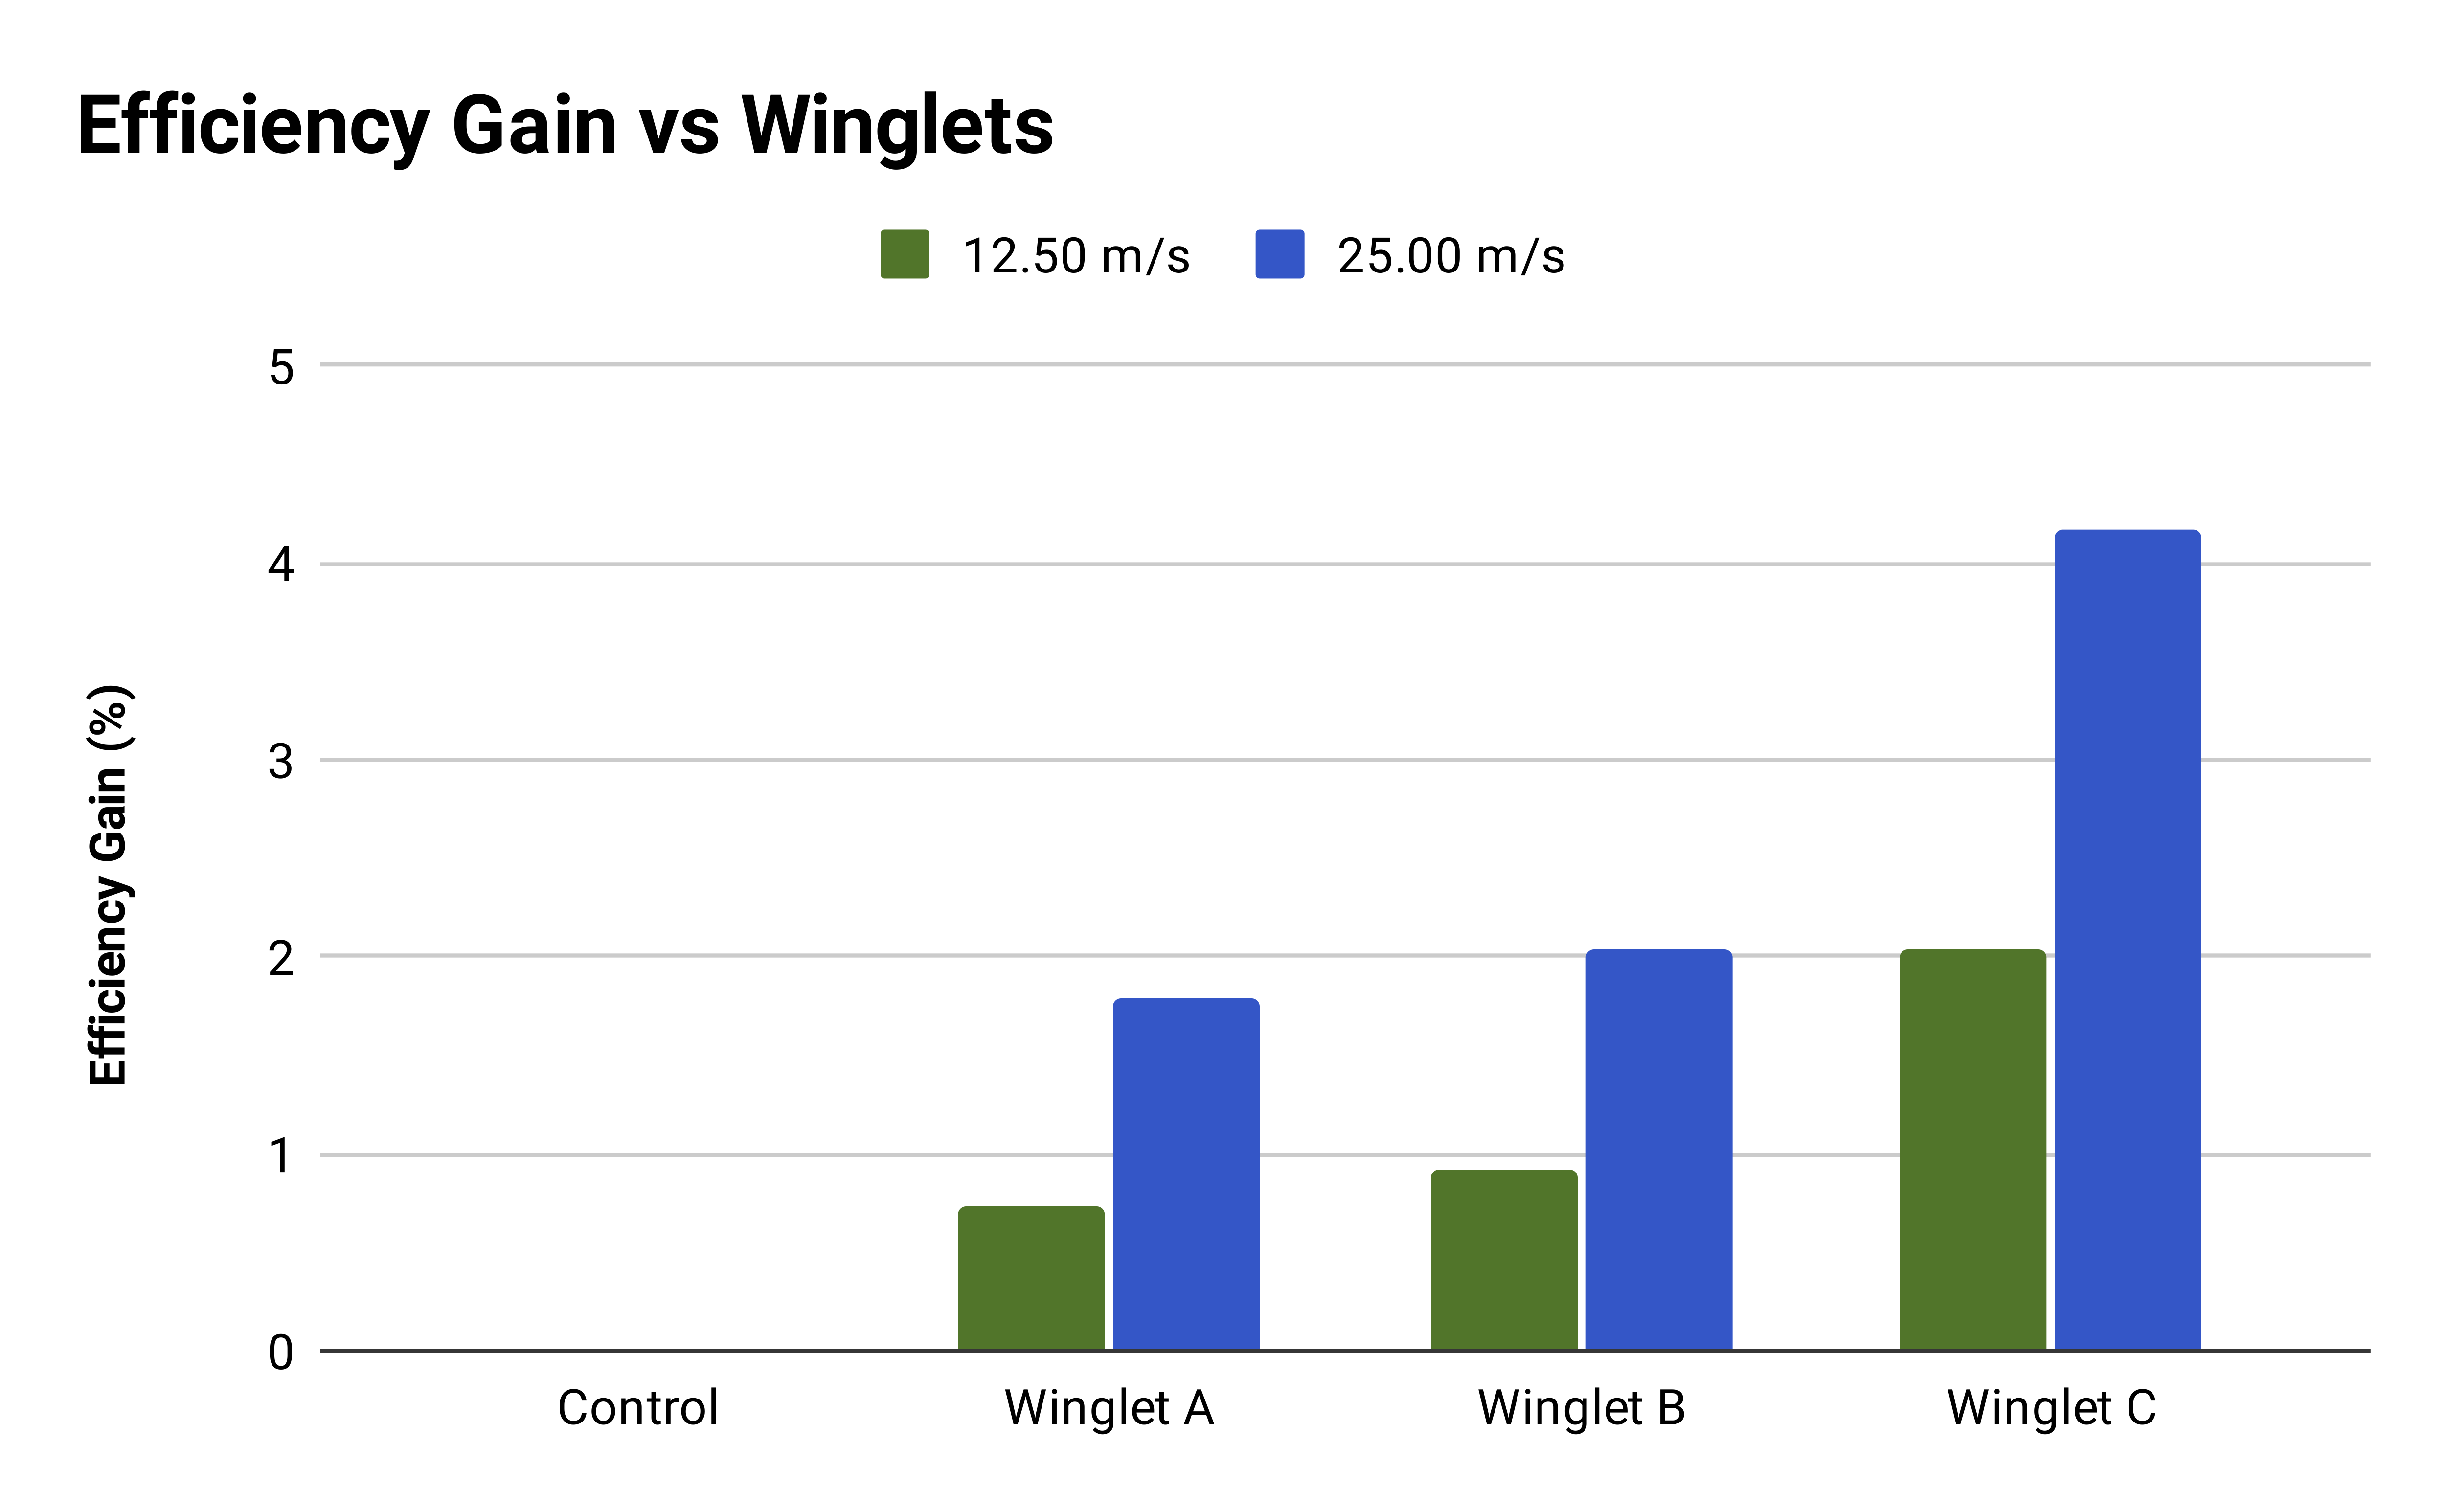
Figure 11.

Figure 12.
Trailing-Edge Flaps
The trials performed on the flaps revealed a negative, quasi-linear relationship between lift increase and efficiency loss across the range of angles tested, exhibited in Figures 13 & 14. Additionally, the wing pitch moment curve is demonstrated in Figure 15, with positive values being a downward-pitching moment. The growth of the low-pressure region aft of the flap can be appreciated in Figures 16, 17 & 18, which correspond to 0º, 10º & 20º deflections. All simulations comprised only one wing, therefore, lift values must be multiplied by two for the total lift generated by the aircraft’s wings.
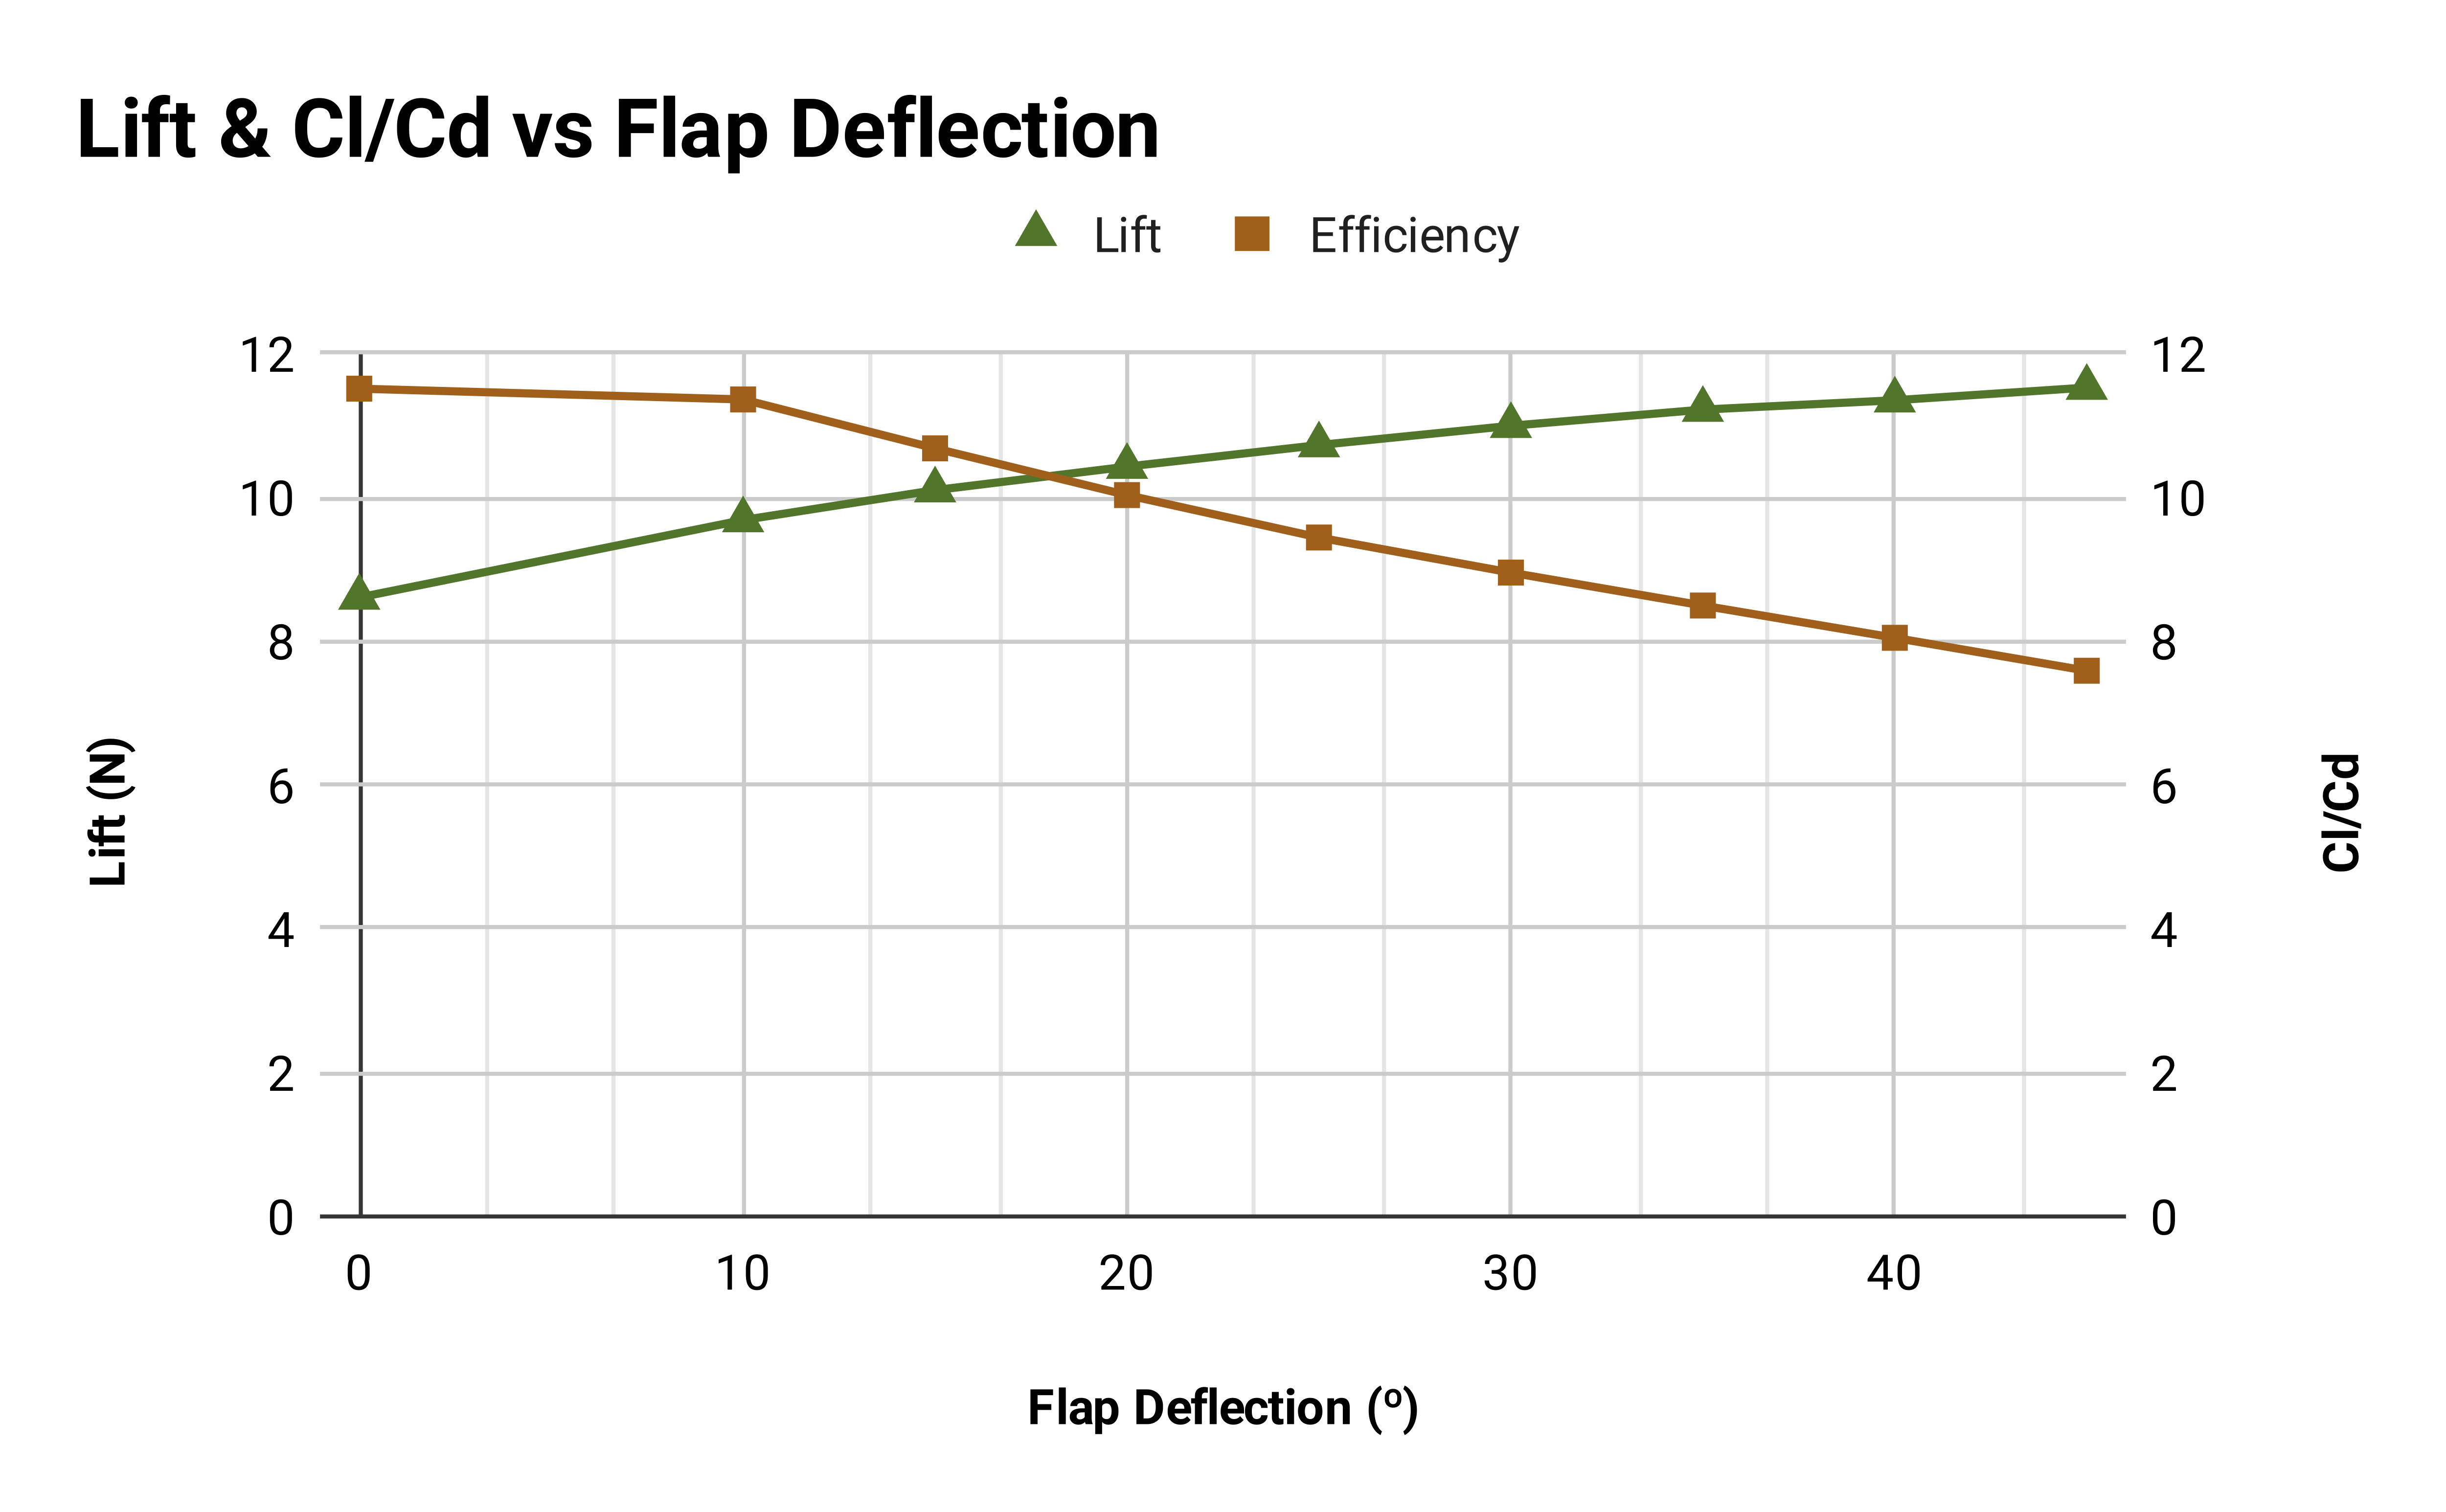
Figure 13.
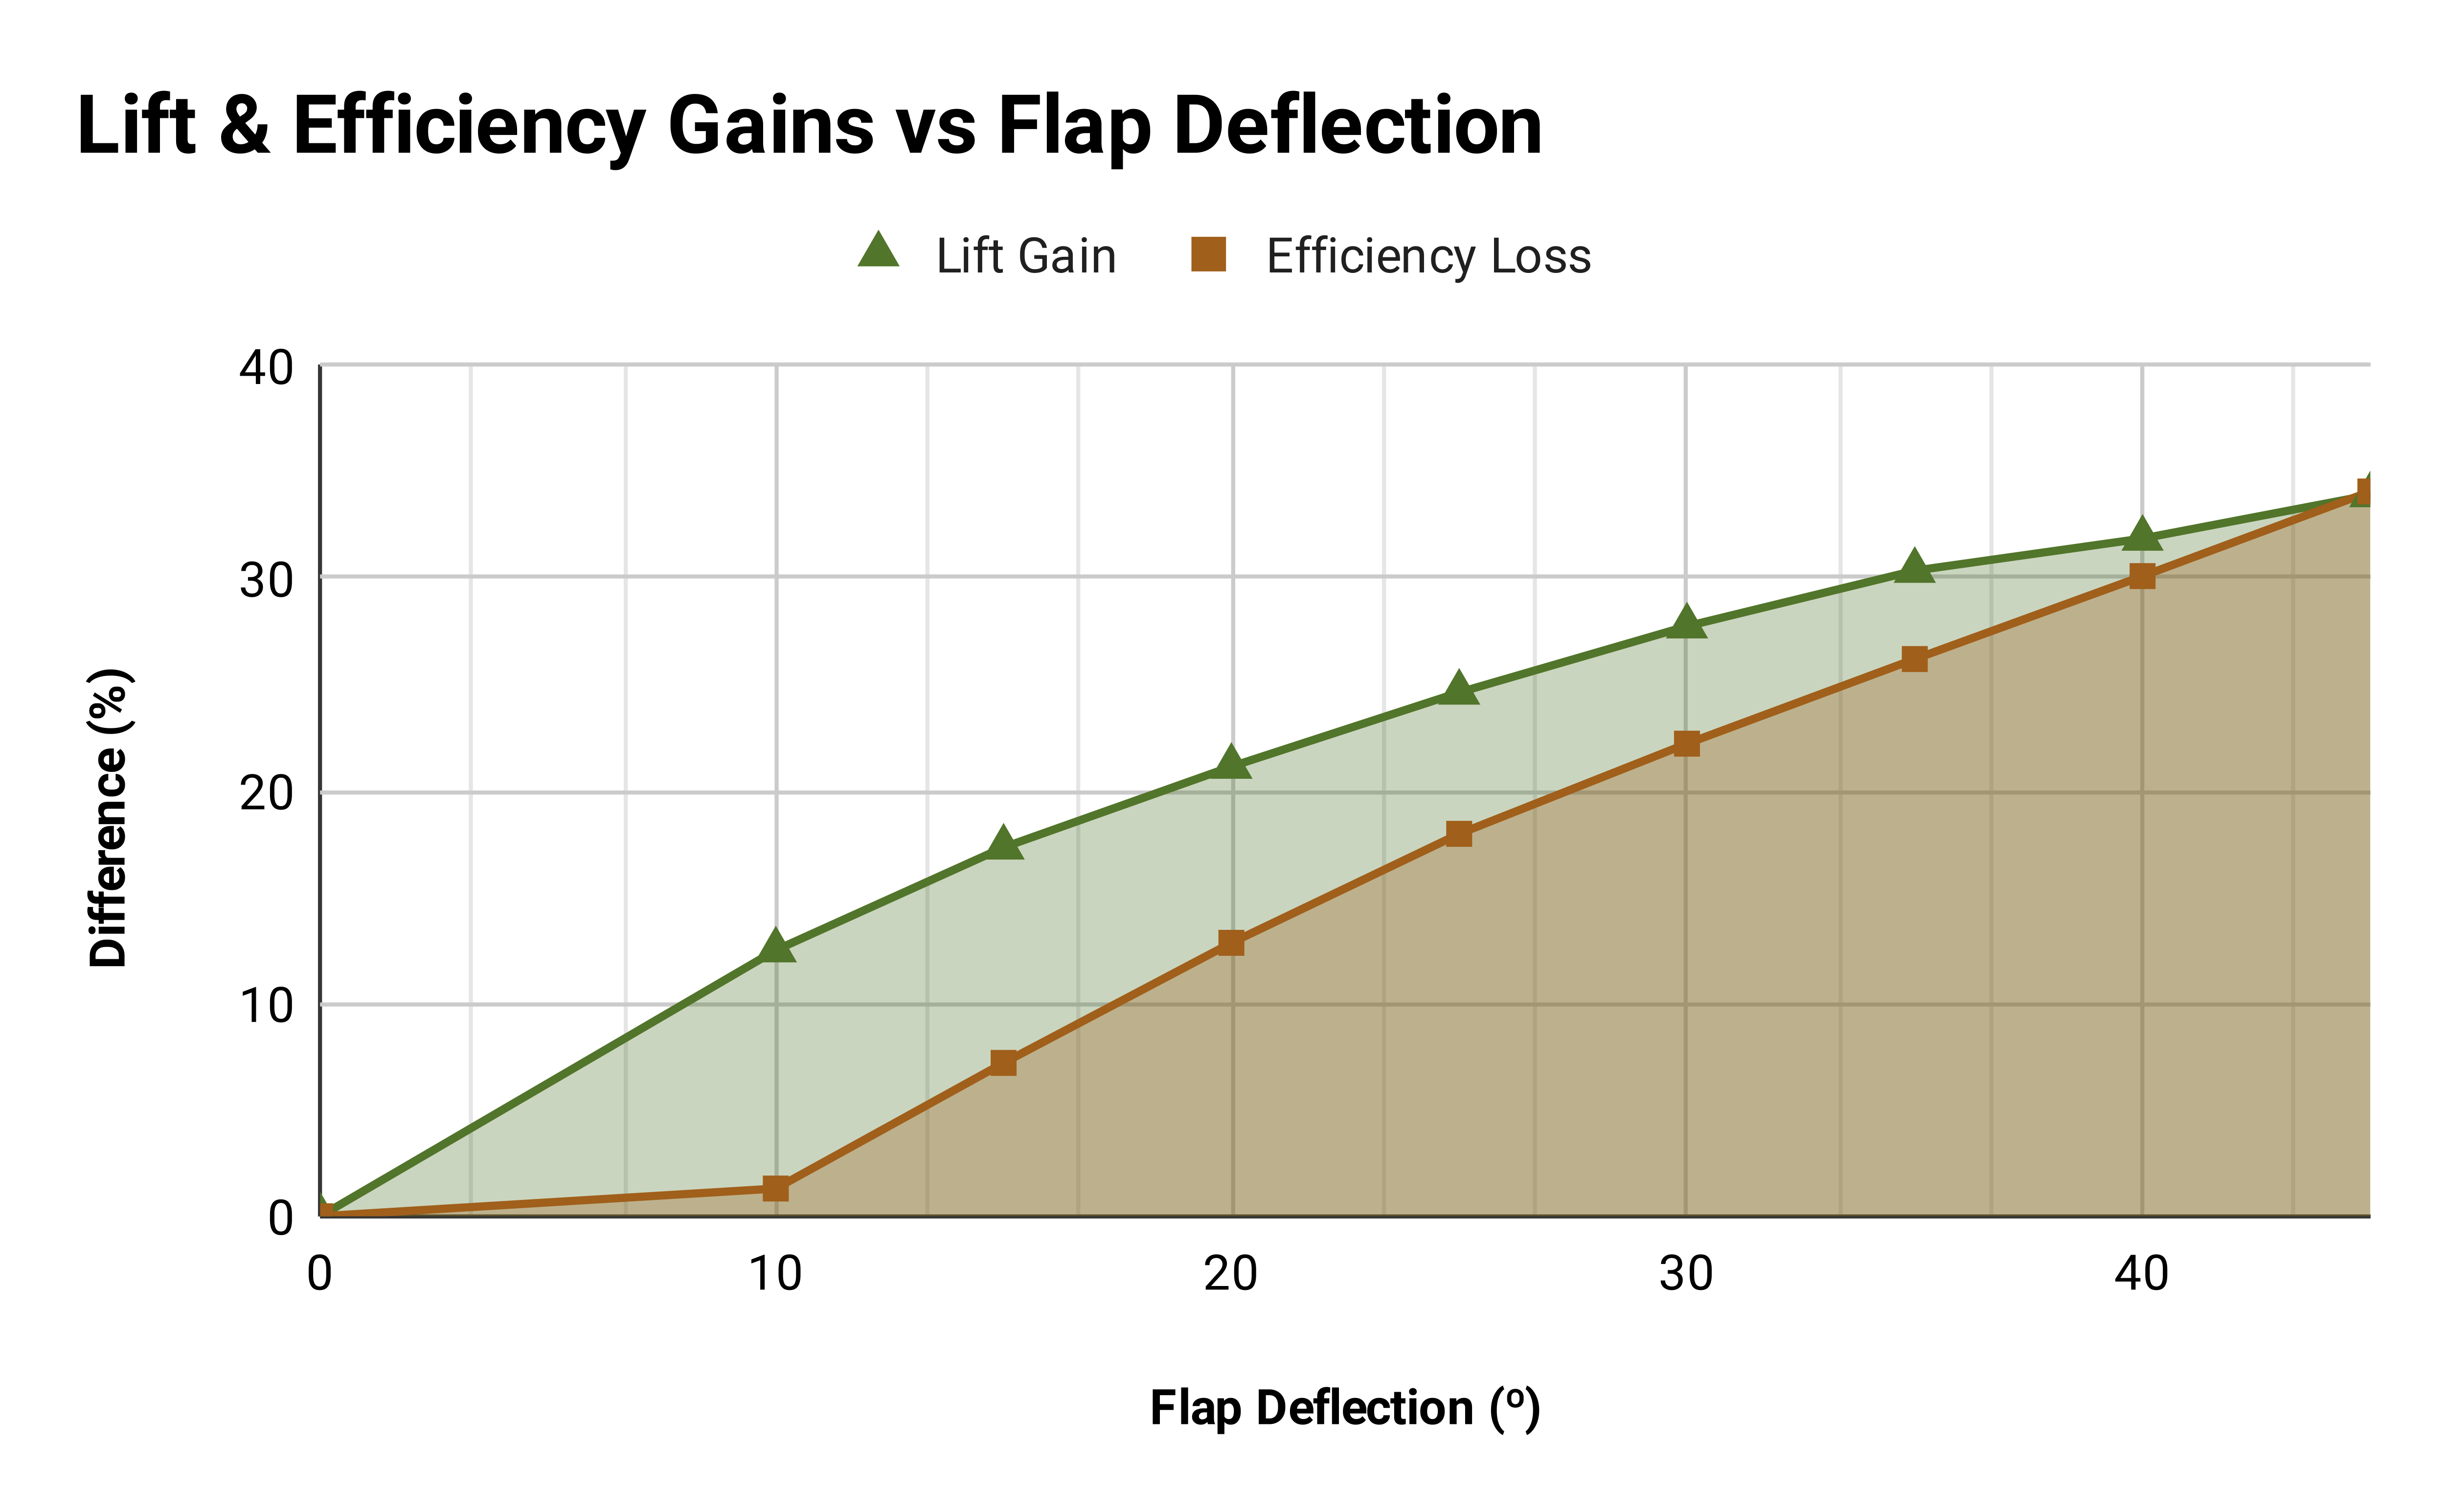
Figure 14.
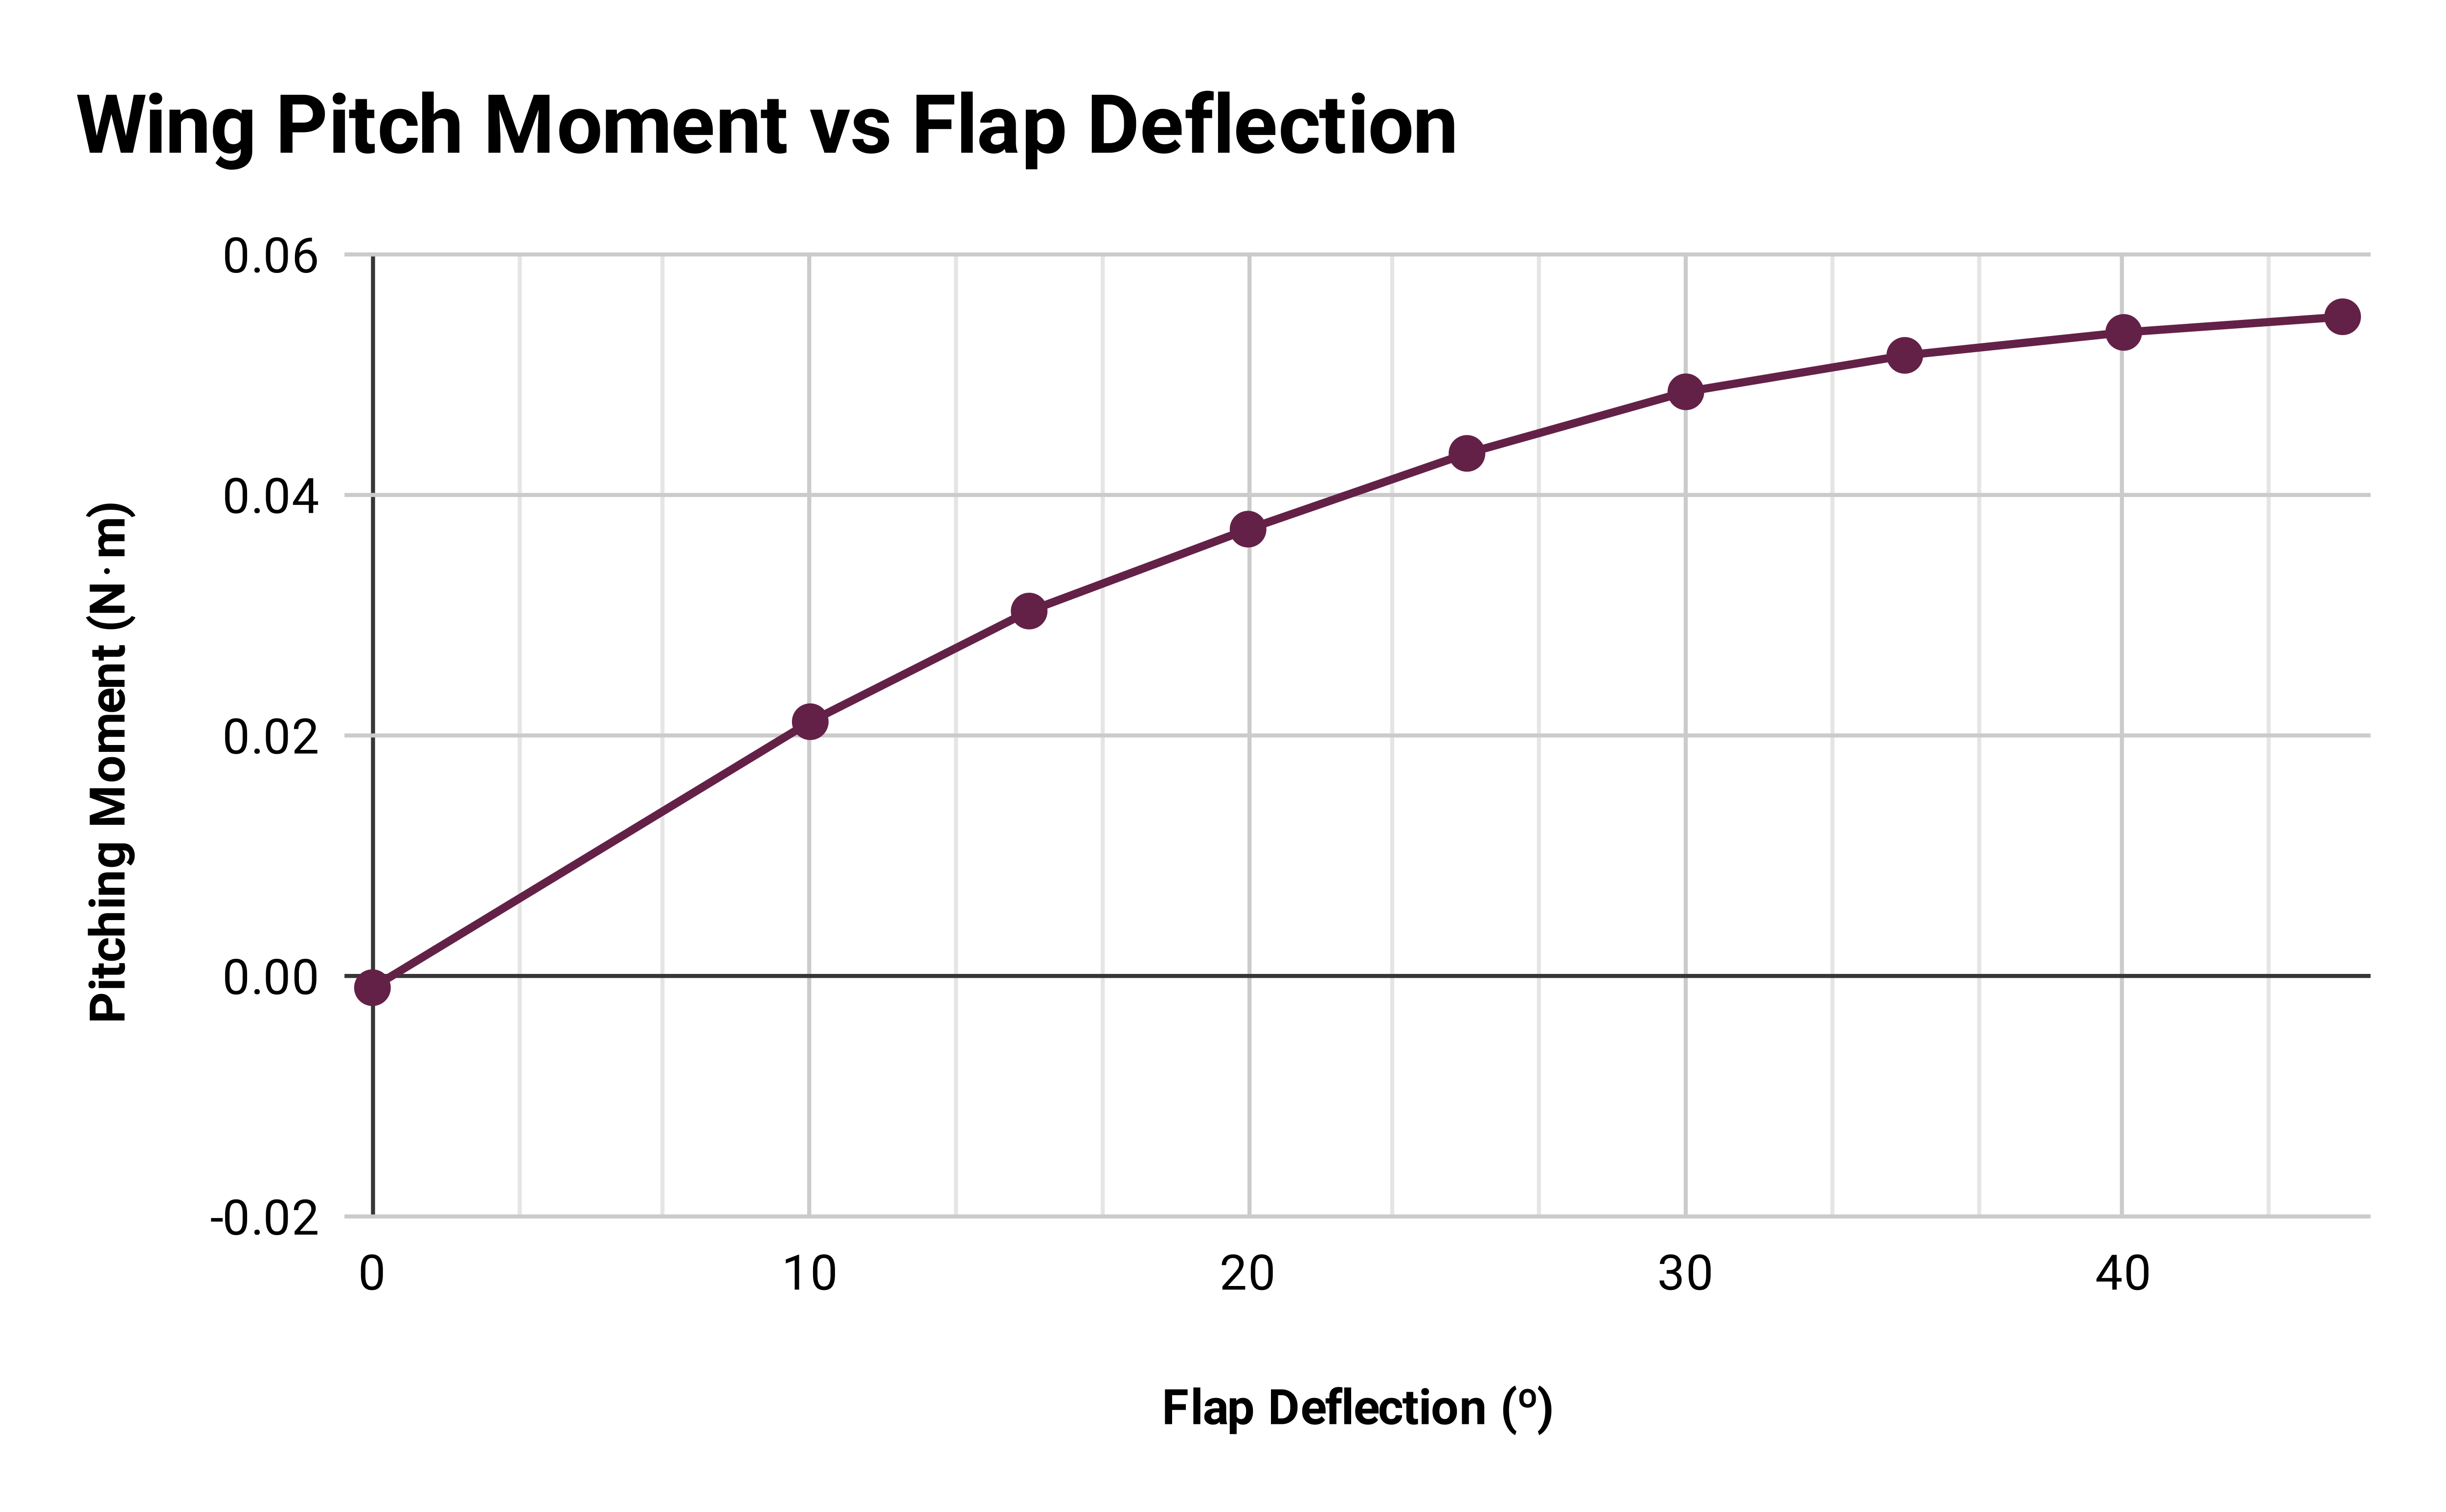
Figure 15.

Figure 16. No flap deflection.

Figure 17. 10º of flap deflection.

Figure 18. 20º of flap deflection.
Airframe
The three 25 m/s airframe trials revealed the pitching moments and net lift that corresponded with different ruddervator deflection angles, observed in Figure 19. As the simulation consisted of only one half of the aircraft geometry, lift values must be multiplied by two to reflect the total lift generated by the aircraft’s wings. A positive moment equates to downward pitching, and a negative means upward pitching. In addition, a particle trace revealed suboptimal flow patterns surrounding the nacelle, presented in Figures 20 & 21. Figure 22 provides a top-down cutting plane view of the flow pattern.

Figure 19.
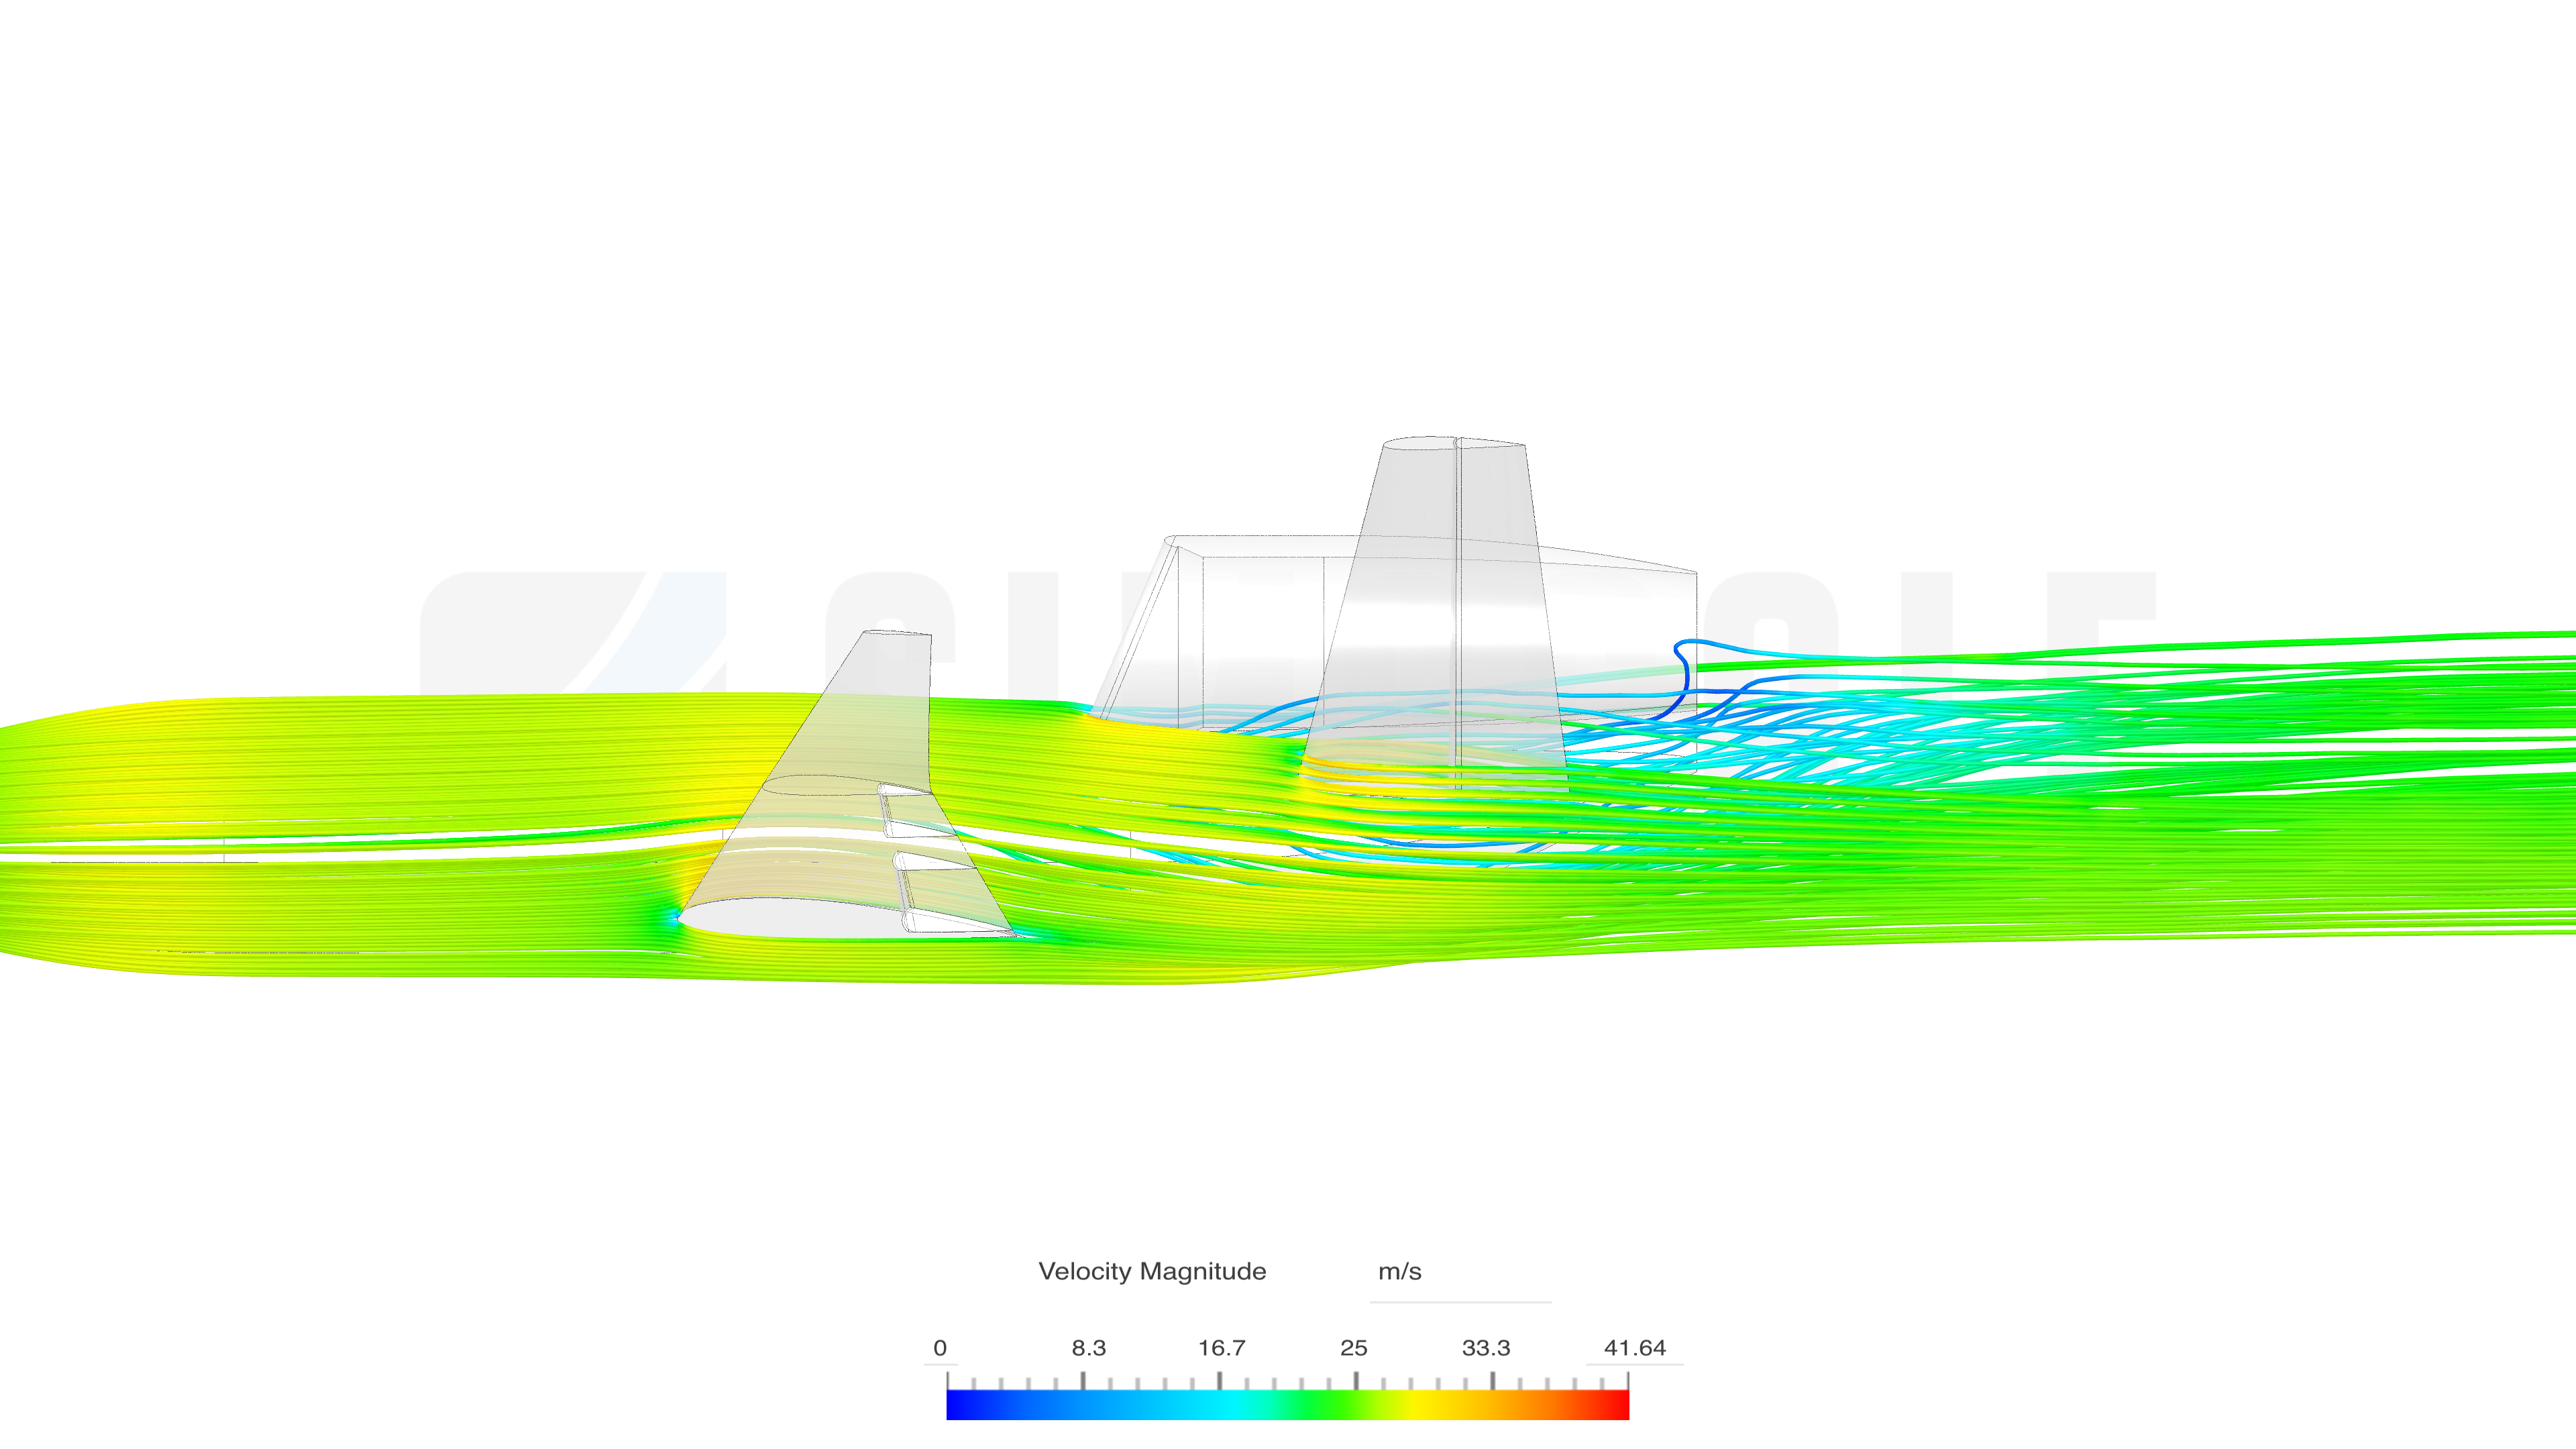
Figure 20. Particle trace side view.

Figure 21. Particle trace rear view.
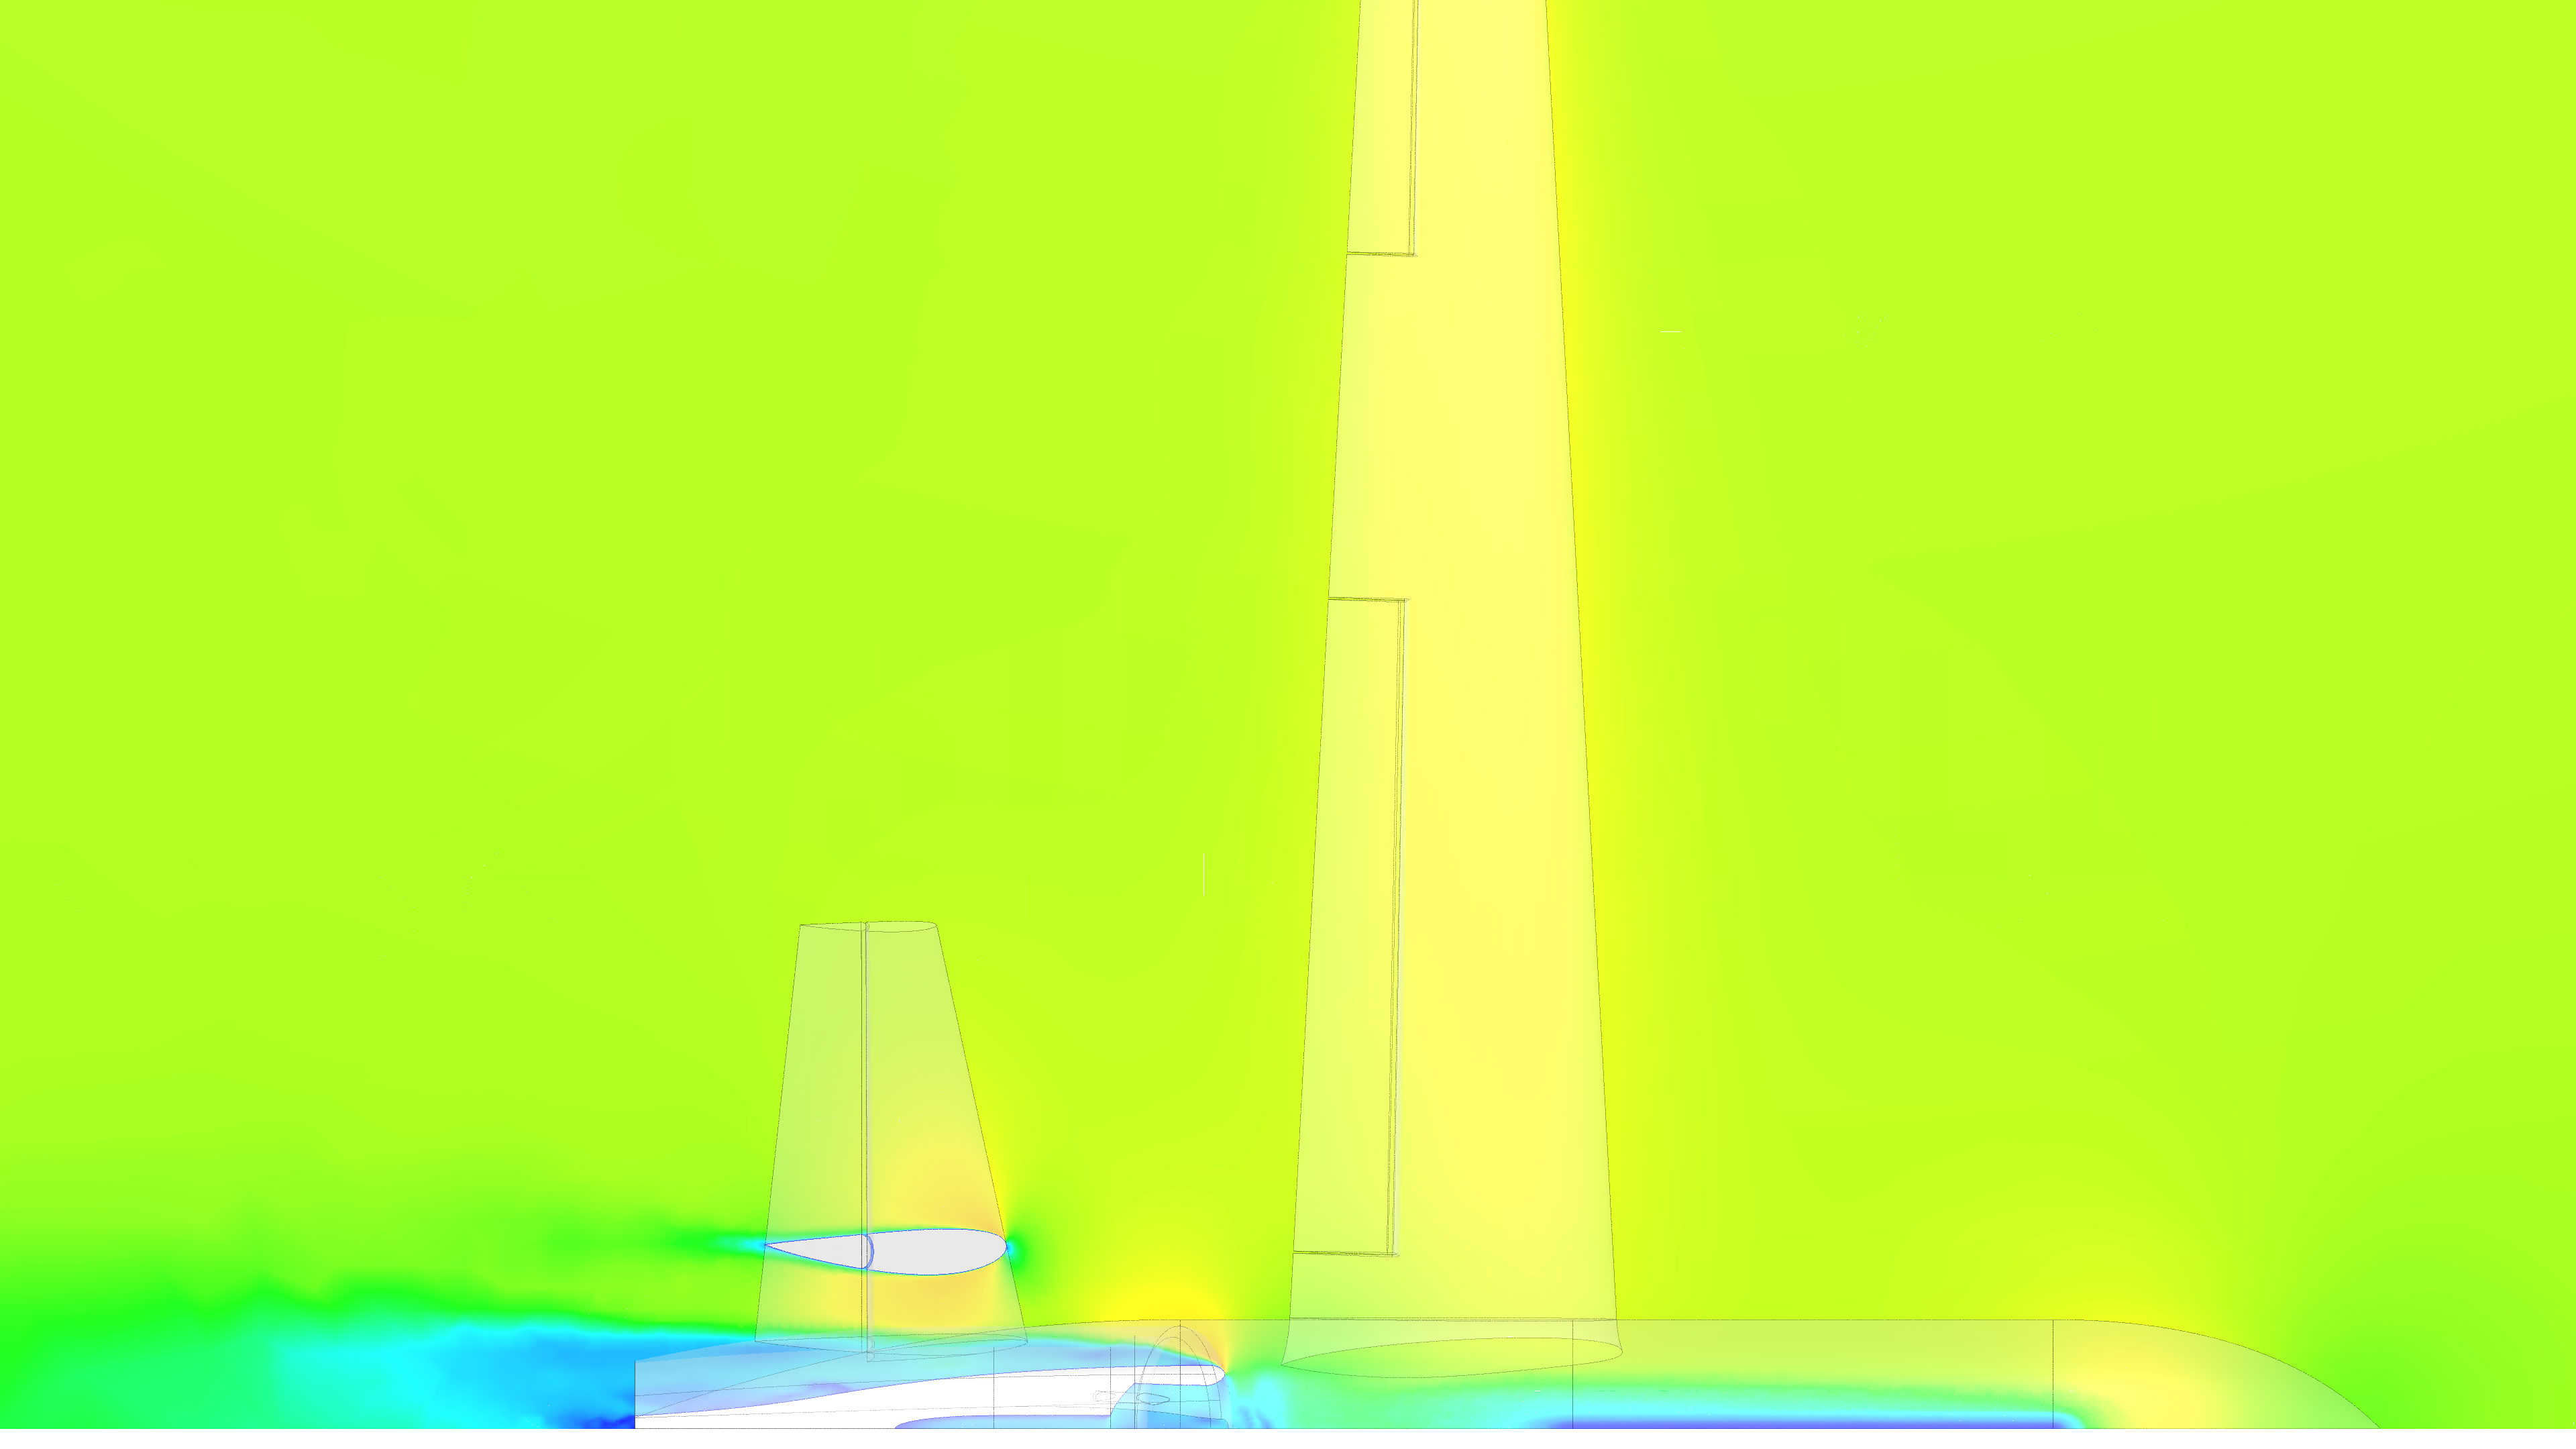
Figure 22. Flow pattern around nacelle.
Discussion
Efficiency Enhancements
The eight winglet trials reveal that Winglet C provides the highest efficiency at both 12.50 m/s and 25.00 m/s, with a 2.041% and 4.177% efficiency increase, respectively. The observed wing efficiency increases also reveal that the particular winglet geometry is 104.7% more efficient at cruise speed. Furthermore, Winglet C also provides the greatest absolute lift force, increasing wing lift by 10.36% at 12.50 m/s, and 11.36% at 25.00 m/s. Unlike efficiency, lift does not increase by a factor of two, meaning that greater efficiency during cruise is the primary value added by the winglet. Notably, at cruise speed, Winglet C only adds 25.11% more lift than the second-best candidate, yet it does so with 206.1% of the efficiency.
Stability Attributes
The nine flap trials reveal the diminishing efficiency of increasing lift force as a function of flap deflection, reflected by the convergence of the lift and efficiency lines in Figure 14. Likewise, the downward pitching moment produced by the flaps diminishes with an increasing angle of deflection. At a 45º deployment angle, the lift curve and the efficiency curve near an equilibrium point. Therefore, through extrapolation, it can be inferred that the drag increase outweighs the lift increase at deflection angles beyond such point.
The three full aircraft trials reveal the apparent linear relationship between the net lift and the pitching moment of the aircraft, observed in Figure 19. Interpolating the available data, it can be inferred that a ruddervator deflection of ≈7.5º would result in level flight. Comparing the aircraft’s Cl/Cd values, the aircraft achieves a 91.19% relative cruise efficiency at 5º of deflection and 76.31% at 10º. Therefore, it can be estimated that the aircraft would operate at 83.75% relative efficiency in level flight. However, the distance from the wing to the C.G. can be reduced to increase the relative efficiency, though it will also decrease longitudinal static stability.
Study Limitations & Future Work
Ultimately, the previous CFD simulations provide insight into the performance nuances of the aircraft. The winglet trials identified Winglet C as the most beneficial winglet. For the flap tests, a deflection angle of up to approximately 45º provides a net benefit. The full-aircraft analyses ascertain the trim setting required for level flight. In addition, all of the simulations performed reveal other areas of improvement for the proposed aircraft design, such as the undesirable flow patterns observed in Figure 20, or the excessive angle of incidence of the wing for cruising at 25 m/s. To address the former, a design transition to a blended nacelle would mitigate the turbulent zones aft of the intake ring due to the gap between the fuselage. To address the latter, simulations of wing lift with 1º angle-of-attack decrements would isolate the ideal angle, as the current aircraft produces 208.9% the required lift for level flight at cruise speed. Furthermore, no simulations tested the impact of the extended landing gear on drag production and the pitching moment.
In future, empirical validation of CFD analyses could yield higher-fidelity results on which to base optimizations, which would be conducive to a better final aircraft design. Areas of exploration could be structural analysis simulation or empirical structural testing to consider in optimizations, transient incompressible simulations to capture time-dependent phenomena and the investigation of more advanced aerodynamic elements, such as leading-edge slats, vortex generators, turbulators and NACA ducts.
As the aerospace sector expands, the ability provided by additive manufacturing to validate aerodynamic designs will continue to become more accessible. Simultaneously, the benefit supplied by CFD simulation will also continue to grow as the technology matures.
References
Altiparmak, Sadettin Cem, and Bowen Xiao. “A market assessment of additive manufacturing potential for the aerospace industry.” Journal of Manufacturing Processes, vol. 68, no. A, 2021, pp. 728-738. ScienceDirect, https://www.sciencedirect.com/science/article/abs/pii/S1526612521004102. Accessed 27 May 2024.
Cornell, Andrea, et al. “Drones take to the sky, potentially disrupting last-mile delivery.” McKinsey & Company, 3 January 2023, https://www.mckinsey.com/industries/aerospace-and-defense/our-insights/future-air-mobility-blog/drones-take-to-the-sky-potentially-disrupting-last-mile-delivery. Accessed 4 June 2024.
Gupta, Anunay, et al. “Advances of UAVs toward Future Transportation: The State-of-the-Art, Challenges, and Opportunities.” Future Transportation, vol. 1, no. 2, 2021, pp. 326-350, https://www.mdpi.com/2673-7590/1/2/19.
Mohsan, Syed Agha Hassnain, et al. “Unmanned aerial vehicles (UAVs): practical aspects, applications, open challenges, security issues, and future trends.” Intelligent Service Robotics, vol. 16, 2023, pp. 109-137, https://link.springer.com/article/10.1007/s11370-022-00452-4.
Nelson, Robert C. “Static Stability and Control.” Flight Stability and Automatic Control, 2 ed., McGraw Hill, 1998, pp. 41-42. Iowa State University, https://home.engineering.iastate.edu/~shermanp/AERE355/lectures/Flight_Stability_and_Automatic_Control_N.pdf. Accessed 14 May 2024.
Orellana Barrasa, Jaime, et al. “Characterisation and Modelling of PLA Filaments and Evolution with Time.” Polymers, vol. 13, no. 17, 2021, p. 2899. National Library of Medicine, https://www.ncbi.nlm.nih.gov/pmc/articles/PMC8434208/. Accessed 28 May 2024.
Impact on reynolds number on real-world model (reynolds number calculator on airfoiltools.com said that number was 128k-256k for the 12.5m/s and 25m/s conditions, respectively)
Better airfoil (Cl/Cd-wise) than NACA-2412 is SD7037