Marco Montalbano – Applied Science
Abstract
This paper examines the research behind and creation of an IOS app which classifies several different types of skin cancer using a neural network. Currently it is estimated that 1 in 58 Americans will develop skin cancer and the cost of diagnosis and treatment can range anywhere from US$500-US$20,000 (Rigel et al., 2010; Guy et al., 2012). This high price creates an income barrier for getting a diagnosis, additionally the misdiagnosis of a benign skin lesions as malignant could lead to significant financial burden with no benefit to the individual. For this reason, it is critical to produce a technique which is easily accessible and can affordably diagnose skin cancer. A neural network which is packaged in a phone app and trained on a highly diverse data set on skin cancer could mitigate this price burden while making a diagnosis more accessible. A model was made using create MLs framework and was trained on the HAM10000 data set. A testing data set was created from various random images from the International Skin Imaging Collaborations Archive which consisted of 2050 images, broken into the same categories as the HAM10000 data set. The model created has an average precision, recall, and specificity of 53.1%, 45.7% and 91.7% respectively. The effectiveness of the model is low when compared to other diagnostic techniques such as a dermatologist with a dermascope, which can achieve a recall of 92% recall and a 99% specifcity rate. For this reason, further improvements will need to be made before it is released to the public. A possible improvement could be an input which allows a user to add in the diameter of the lesion; this could help to improve the output of the neural network as size is an important factor in the diagnosis of melanoma and other skin cancers. This would also allow user to track the growth of individual tumors.
Introduction
Skin cancer is broken into three major categories: basal cell carcinoma, squamous cell carcinoma and melanoma. Out of the three skin cancers, melanoma is the deadliest, with a late-stage 5-year survivability in the United States of 15.7%; additionally, people over the age of 65 have a lower 5-year survivability rate for melanoma at any stage (Pollack et al., 2011; Yang et al., 2020). Mortality rates due to melanoma have also been increasing amongst older populations (Yang et al., 2020), indicating that more of the most vulnerable are suffering from this disease. Currently, it is estimated that “the lifetime risk of an American developing invasive melanoma is approximately 1 in 58” (Rigel et al., 2010). The prognosis is dependent on the vertical depth of the melanoma, which grows deeper with time; consequently, diagnosing melanoma early is of utmost importance (Rigel et al., 2010).
Not only are the rates of mortality due to melanoma increasing, but the cost of treating and diagnosing melanoma remain high, with “annual per-patient costs ranging from US$506, among prevalent cases of melanoma, to US$23,410 among newly diagnosed cases” (Guy et al., 2012), with the highest treatment cost occurring either for late stage or terminal melanoma (Guy et al., 2012).
For these reasons, early diagnosis of melanoma is critical to ensure a high survivability rate and reduce the financial burden on the patient and medical system. The “ABCDE” is one of the most widely accepted protocols for identifying melanoma in its early stage during mass screening and self-examination. The ABCDE was created by dermatologists at the NYU Langone Medical Center: “A” stands for Asymmetry, is the mole symmetrical?; “B” for Border, is the border uniform?; “C” for Color, is there a variation of color on the mole?; “D” for Diameter, is it more significant than 6 millimeters?; “E” for Evolving does it look different from other spots or is the changing in some way?. It is essential to note that not all of these factors must be present for a proper diagnosis of melanoma (Rigel et al., 2010).
One of the most common methods used to diagnose melanoma in dermatology is dermoscopy, adopted in the 1990s – it “allows an observer to examine pigmented skin lesions covered by a drop of oil and a glass slide through a stereo microscope” (Rigel et al., 2010). Most dermascopes use a 10X magnification, and new models use polarizer filters that remove the need for oil. Dermoscopy dramatically increased the sensitivity and specificity of clinical diagnosis, with dermatologists with 5 years of experience or more having a 92% sensitivity rate and a 99% specificity rate, meaning that both false positives and negatives are low. More modern adaptations of dermoscopy have been made, with recent dermascopes able to capture images.
Other modern advances have been made in diagnosis strategies, such as optical measurements (broken into Optical Imaging and Optical Spectroscopy), skin electrical measurements, and thermal measurements (Blundo et al., 2021). Each of these unique diagnosis tools have variable sensitivity and specificity levels and can influence the diagnosis success rate; particularly when used in combination with each other or dermoscopy. Optical imaging uses reflected light to image a mole and determine if it is cancerous. Optical Imaging can be broken into three categories commonly found in literature: melanoma Reflectance Confocal Microscopy (RCM), Multispectral Imaging (MI) and Optical Coherence Tomography (OCT) (Rigel et al., 2010). RCM uses wavelengths between 550 nm and 1000 nm to allow better diagnosis of benign and malignant tumors. When used with dermoscopy, it can increase the accuracy of melanoma detection. However, it is very dependent on experienced users, achieving a much higher sensitivity than with novice users (Blundo et al., 2021; Rigel et al., 2010). MI combines several different wavelengths with a neural network to classify a tumor as malignant or benign. Different wavelengths of light will penetrate the skin to different depths, allowing images to be optioned for different layers of the skin; the technique allows a dermatologist to probe to a depth of 2mm with a sensitivity of between 95-100% and a specificity of between 70-85%. OCT allows an examination to a depth of 1 millimeter – light which reflects melanin and cell membrane characterizes the tumor. Research on OCT is limited, but it has a reported specificity of 92.4% and sensitivity of 74.1%. Skin electrical measurements (bioimpedance) classify a tumor as malignant or benign and can measure to a depth of 2mm. Bioimpedance has a 92% to 100% sensitivity and 67% to 75% specificity for early-stage and thin melanoma. Finally, thermal measurements work off the theory that benign and malignant tumors have different metabolic activities. This process utilizes a thermal camera to collect data, however, the specificity and sensitivity could not be found in the reviewed literature (Blundo et al., 2021).
There have been several implementations of machine learning (neural networks) to classify skin cancer, most of which use optical measurements. Many models use dermatoscopic images (high-quality images taken through a derma scope) from the International Skin Imaging Collaboration (ISIC) as training and testing data (Jojoa Acosta et al., 2021). The data sets available on the ISIC website are broken into three categories for skin lesions of interest: melanoma, nevus, and keratosis. Amongst currently implemented neural networks, Convolutional Neural Networks (CNN) trained on all three categories are the most popular, while the most effective implementations take a multi-step approach to classification. Jojoa Acosta et al. used an object detection neural network to identify the mole then cropped the image using a mask, so only that data was used in the classification model. It is essential to isolate the region being measured as “hairs, inks, ruler markings, colored patches, glimmers of light, drops, oil bubbles, blood vessels, hypopigmentation areas and/or inflammation around the lesion” (Jojoa Acosta et al., 2021) can affect classification results. Jojoa Acosta et al. also noted that “an increase in the number of original images does not fully guarantee a better result in terms of classification metrics,” likely because this could lead to overfitting of the model. González-Cruz et al. found that currently, “only 36.6% of our melanomas were admissible for analysis by state-of-the-art ML systems” (González-Cruz et al., 2020); this was due to limited training data sets which did not include no-ideal images. González-Cruz et al. suggested, to address these issues, neural networks should be trained on data sets which do not contain the entire tumor. Similarly, Bhatt et al. found that “most researchers did not use standard datasets or employed small samples” (Bhatt et al., 2023), which often contained minimal images for darker-skinned individuals.
Most current methods used to diagnose melanoma require expensive equipment and years of training to have high specificity and sensitivity; this increases the difficulty for an individual to get a diagnosis, especially if they are financial challenged and do not have health care coverage. For this reason, a neural network which is freely available to the public and runs locally on a mobile phone using optic images to classify data would increase the availability of getting an accurate diagnosis and detecting melanoma early; saving medical systems money and people’s lives.
When developing a neural network to characterize melanoma from a mobile phone camera, it is critical to ensure that a wide variety of training data is used, including images of a range of skin pigmentations. It is not feasible to expect an image with as much detail as a dermoscopy image, which most publicly available data sets use, to be taken by a mobile phone. For this reason, it is essential to alter any dermoscopy training data to make it appear more like what would be captured by a mobile phone. To have an adequate model, it will be essential to have a training data set that is large enough to meet these criteria while ensuring the model does not overfit that data and has both a high sensitivity and specificity.
Materials and Methods
Data Set
To train the model the HAM10000(Human Against Machine) data set was used. The HAM10000 data set was created by Philipp Tschandl and Harald Kittler from the Department of Dermatology in the Medical University of Vienna, as well as Cliff Rosendahl from the faculty of Medicine at the University of Queensland (Tschandl et al., 2018). The HAM10000 data set consists of 10015 curated images of 8 different kinds of skin lesions split into seven categories: Actinic keratoses and intraepithelial carcinoma which are labeled as akiec, basal cell carcinoma labeled as bcc, benign keratosis-like lesions labeled as bkl, dermatofibroma labeled as df, melanoma labeled as mel, melanocytic nevi labeled as nv and finally vascular lesion labeled as vasc (Mader, n.d.). According to Tschandl, Kittler, and Rosendahl the data was collected from a diverse group of people and all diagnosis have been confirmed through pathology, expert consensus, or confirmation by in-vivo confocal microscopy. The data set contains 7 columns: lesion ID, Image ID, the diagnosis (dx), how the diagnosis was made (dx_type), age of subject, sex, and the lesions location on the body. Due to time constraints the model created will only take pixel data as an input and output a prediction for diagnosis.
Preprocessing
All of the images in the HAM10000 data set were manually cropped by the original creators of the data set to an image size of 800 by 600 pixels with the lesion in the center. However, Apple’s machine learning program creation software Create ML can only handle images of size 360 by 360 pixels for this reason downsizing each image was necessary, to do this the python CV2 library was used. However, this came at the potential cost of reduced real-world accuracy as the original images where not square. This means when the images were down-scaled they were also distorted; creating a possible error because, as mentioned in the introduction, shape is a key factor for melanoma and skin cancer detection. After the images were scaled, they were sorted in folders according to their diagnosis tags.
Model Creation
Apple’s software Create ML was used to train and create the neural network. Create ML has a predefined CNN to process images, while this does limit the customizability of the model, given the time frame for this project, it allowed a project to be built that can accurately classify multiple types of skin lesions. Additionally, building it in a IOS framework made it easier to integrate the model into an application later on. The base model used for this image classification was Image Feature Print V2 a predefined model by Apple which has been optimized for speed and storage usage (Apple, n.d.). Copies of each image were then created and saved to the training data which added blur, rotated or flipped the image. The model was given a total of 1840 training iterations.
Test Data Set
The test set was created from 2050 images pulled from the ISIC’s archive.
Results
Table 1, 2, and 3 show the results of the model for training, validating, and testing data sets.
Table 1: Containing the data for training accuracy of the model.

Table 2: Containing the data for the validation accuracy of the model.

Table 3: Containing the data for the testing data set of the model.

Discussion
As mentioned in the introduction it is important to create a model which has a high sensitivity and specificity when releasing a model to the public which would diagnose skin cancer. In Tables 1 and 2, the recall of the model is the same measurement as sensitivity. Precision is the measurement of the proportion of correct positive identifications, in other words when a prediction is made the probability that prediction will be correct. Recall, on the other hand, refers to the proportion of actual positives identified, or the proportion of tumors correctly identified. Recall and precision are expressed by the following formulas:

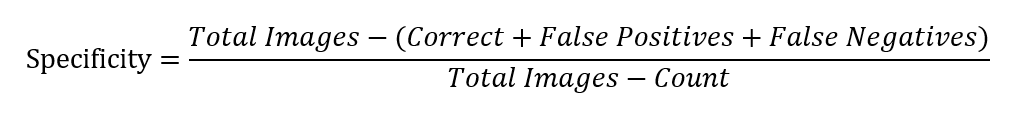
The specificity for each row was calculated using the following formula:
The analysis will focus on table 3, which is the results of the testing data.

Figure 1: A histogram of the number of images, the number of images classified correctly as well as false positives and false negatives for each diagnosis type, based off the data in Table 3.
Figure 1 shows a histogram comparing the number of images classified correctly, misclassified correctly (false positives) or misclassified incorrectly (false negatives). To have a strong model the Bkl, Nv, Df, and Vasc which are generally considered benign lesions and therefore they would need to have a low false positive rate. A high false positive rate would indicate that the model is frequently classifying tumors which could be malignant as begin. For cancerous lesions like melanoma (mel), the model needs to show low false negative results. This is evident for mel which has the largest number of images identified false negative, the most common confusion was between melanoma and melanocytic nevi, the model confused 190 photos from the testing data set of melanoma were considered melanocytic nevi.
This is a problem as the model is frequently classifying a cancerous lesion as benign. This error shows that further development will need to go into the model before it is publicly released in the form of an app as malignant tumors are frequently classified as benign and benign lesions are classified as malignant.
While comparing the number of false positives, false negatives, and correct classifications can be useful for understanding the models performance, comparing the specificity, recall, and precision of the model for each classification can provide a better comparison as the testing data set was not perfectly balanced between images. Some classes had a higher count than others, and therefore the number of images classified false positively, false negatively, and correctly will range largely between classes. Additionally, the specificity, recall, and precision will allow the model to be compared to other dermatological tools.
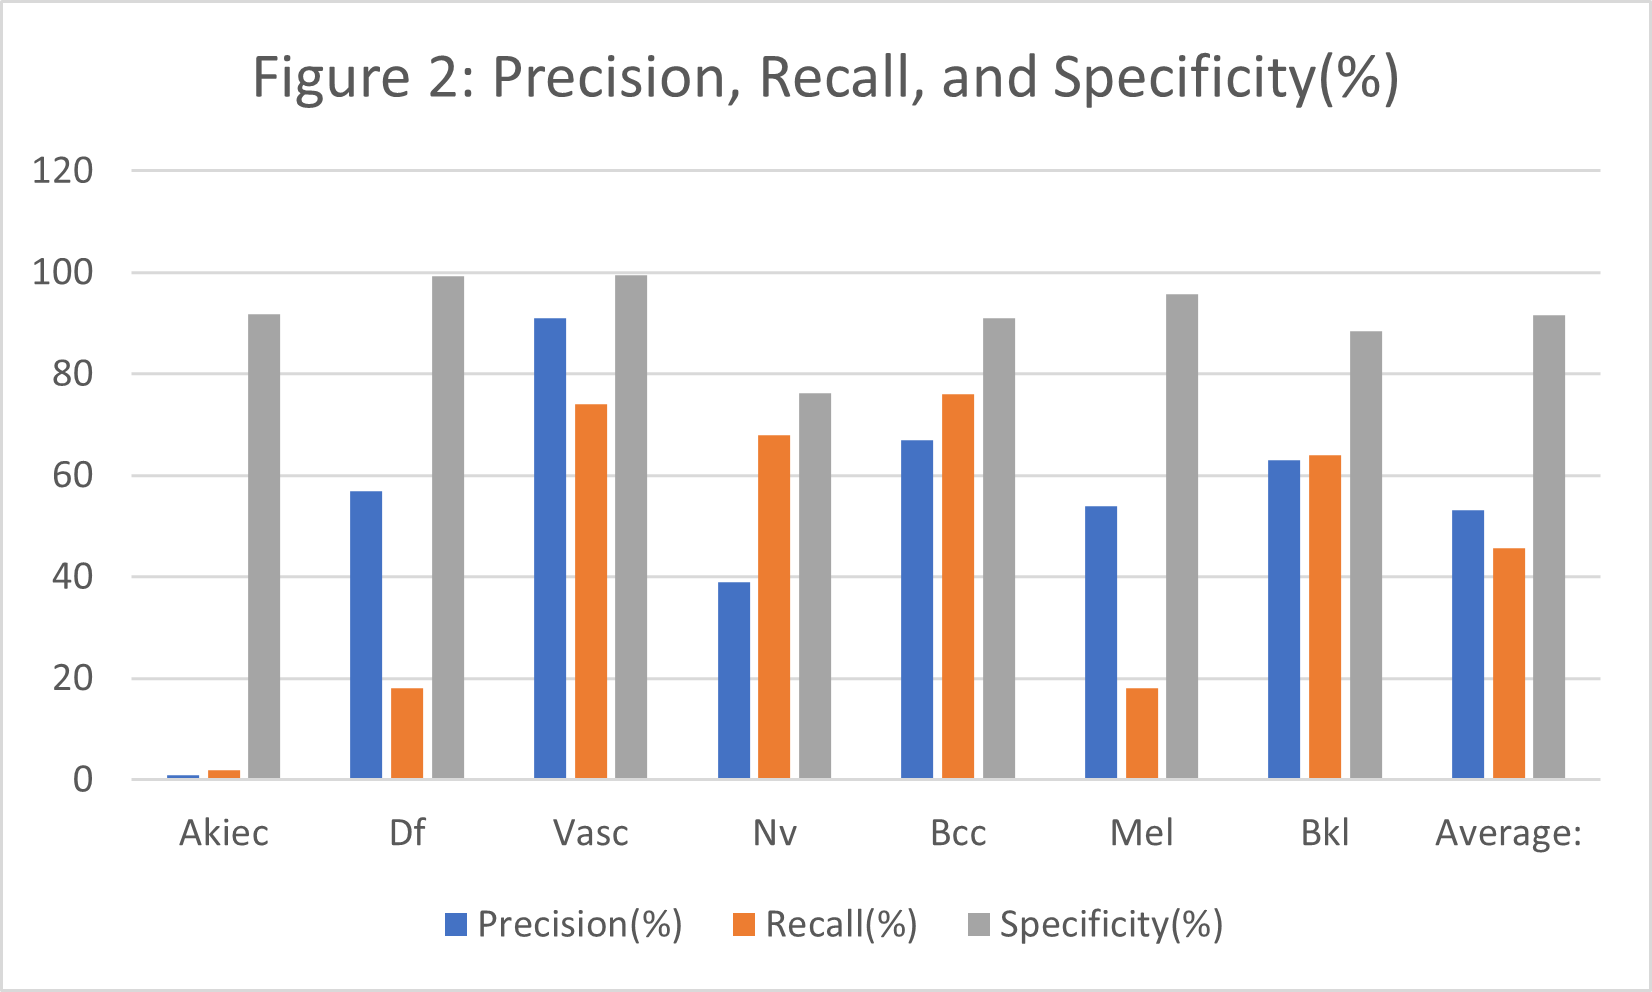
Figure 2: A histogram containing the precision, recall and, specificity for each diagnosis, based off the data in Table 3.
As stated earlier, precision refers to the proportion of times the model is correct when it classifies an image, while recall refers to proportion of times it correctly identifies an image. As can be observed in Figure 2, the model has the highest recall for vascular lesions, which means when the model predicts a vascular lesion it is correct 91% of the time, which is 1% less the dermatologist with 5 years of experience using a dermascope. However, the model does not hold this precision and recall for all classifications, with malignant skin lesion having worse results. The Akiec class which is a grouping of cancerous lesions only has a precision of only 1%. When the 1% precision for the Akiec class is paired with its 2% recall, it presents a major problem with only 2% of tumors correctly identified. The specificity for melanoma is very high at 95.8% indicating that the model is very good at classing images which are not melanoma as not melanoma. The specificity of 95.8% is slightly lower than a dermatologist with 5 years of experience specificity of 99%. However, this could be due to melanoma making up 22.1% of the testing data. Despite this, melanoma only had a precision of 54% and a recall of 18%; so many people may not have their melanoma correctly identified. The malignant lesion which has the best results is basal cell carcinoma which has a precision of 67% and a recall of 76%. The average precision, recall, and specificity of the model are 53.1% , 45.7% and, 91.7% respectively. Indicating that when it makes a prediction of a tumor it is correct 53.1% of the time, that it can correctly identify 45.7% of tumors, and that the model will on average is unlikely to produce a false positive. This compares to a dermatologist who with 5 years of experience using a dermascope having a 92% sensitivity (recall) rate and a 99% specificity rates how.
Table 4 below has the values of sensitivity and specificity for the measurement techniques mentioned in the literature review as well as the results of the model.
Table 4: Containing the data for specificity and sensitivity of the various measurement techniques mentioned in the introduction for which data was available.

As can be observed in Table 4 the model has the lowest sensitivity out of 4 current diagnosis techniques, therefore it is the least reliable when it comes to identifying skin cancer (or any other skin tumor). However, it has the third highest sensitivity ahead of multi spectral imaging and bioimpedance by at least 6.7% to 16.7% specificity respectively. This indicates that it is less likely to produce a false positive when compared to several other diagnosis techniques which are currently on the market.
Due to the low precision and recall of the model it will need to be further improved before being put into an app. An improvement which could be made to yield better results would be allowing user to input measurement and set image scale. This would allow the neural network to take in a size perimeter for each mole, and this could be partnered with object detection to find the area the mole covers. The area of the mole could be used to help a user track its growth which could be useful information to present to a dermatologist.
While the accuracy results were not ideal a basic app UI was built using the model as a proof of concept, note the percentage displayed represents a confidence score by the model (see a link bellow for a video of the model in action):
Further improvements to the app will need to be made to the model are made including a cleaner UI, and an easier to understand naming scheme for various classifications. Additionally adding a page into the app which explains how it works (front and back end) may be useful for a user.
Conclusion
The goal of this research project was to create an open source and freely available app with the ability to classify skin cancer, which could compete with a dermatologist. While a model was successfully created and implemented into a basic UI, the precision of the model was unable to compete with that of a dermatologist. The HAM10000 data set was used as training data and the testing data was a collection of 2050 ICIS’s archives. Average precision, recall, and specificity of the model are 53.1%, 45.7% and, 91.7% respectively, while a dermatologist with 5 years of experience using a dermascope has a recall and specificity of 92% and 99%. The model struggled the most with classifying lesions of the Akiec class, a grouping cancerous lesions, with a 1% precision and 2% recall. Diagnosis for melanoma was also poor with a precision of 54% and recall of 18%. Further improvements should be made to the model to increase the recall and specificity to above 80-85% before releasing the app as this would then be comparable to other diagnosis techniques. Adding a functionality which lets a user input the size of the lesion into the neural network could help to improve accuracy while allowing a user to track tumor growth. On top of the creation of a model to classify skin cancer a basic IOS application was created to house the machine learning model and act as a proof of concept.
References
Alzahrani, S., Al-Bander, B., & Al-Nuaimy, W. (2021). A comprehensive evaluation and benchmarking of convolutional neural networks for melanoma diagnosis. Cancers, 13(17). https://doi.org/10.3390/cancers13174494
Apple. (n.d.). Creating an Image Classifier Model | Apple Developer Documentation. Retrieved March 31, 2024, from https://developer.apple.com/documentation/createml/creating-an-image-classifier-model
Bhatt, H., Shah, V., Shah, K., Shah, R., & Shah, M. (2023). State-of-the-art machine learning techniques for melanoma skin cancer detection and classification: a comprehensive review. In Intelligent Medicine (Vol. 3, Issue 3, pp. 180–190). Chinese Medical Association. https://doi.org/10.1016/j.imed.2022.08.004
Blundo, A., Cignoni, A., Banfi, T., & Ciuti, G. (2021). Comparative Analysis of Diagnostic Techniques for Melanoma Detection: A Systematic Review of Diagnostic Test Accuracy Studies and Meta-Analysis. In Frontiers in Medicine (Vol. 8). Frontiers Media S.A. https://doi.org/10.3389/fmed.2021.637069
González-Cruz, C., Jofre, M., Podlipnik, S., Combalia, M., Gareau, D., Gamboa, M., Vallone, M., Faride Barragán-Estudillo, Z., Tamez-Peña, A., Montoya, J., América Jesús-Silva, M., Carrera, C., Malvehy, J., & Puig, S. (2020). Machine Learning in Melanoma Diagnosis. Limitations About to be Overcome. In Actas Dermosifiliogr (Vol. 111, Issue 4).
Guy, G. P., Ekwueme, D. U., Tangka, F. K., & Richardson, L. C. (2012). Melanoma Treatment Costs: A Systematic Review of the Literature, 1990-2011 The most common form of skin cancer, non-melanoma skin cancer HHS Public Access. Am J Prev Med, 43(5), 537–545. https://doi.org/10.1016/j.amepre.2012.07.031
Jojoa Acosta, M. F., Caballero Tovar, L. Y., Garcia-Zapirain, M. B., & Percybrooks, W. S. (2021). Melanoma diagnosis using deep learning techniques on dermatoscopic images. BMC Medical Imaging, 21(1). https://doi.org/10.1186/s12880-020-00534-8
Mader, K. S. (n.d.). Skin Cancer MNIST: HAM10000. Retrieved March 31, 2024, from https://www.kaggle.com/datasets/kmader/skin-cancer-mnist-ham10000
Rigel, D. S., Russak, J., & Friedman, R. (2010). The Evolution of Melanoma Diagnosis: 25 Years Beyond the ABCDs. CA: A Cancer Journal for Clinicians, 60(5), 301–316. https://doi.org/10.3322/caac.20074
Tschandl, P., Rosendahl, C., & Kittler, H. (2018). Data descriptor: The HAM10000 dataset, a large collection of multi-source dermatoscopic images of common pigmented skin lesions. Scientific Data, 5. https://doi.org/10.1038/sdata.2018.161
Yang, D. D., Salciccioli, J. D., Marshall, D. C., Sheri, A., & Shalhoub, J. (2020). Trends in malignant melanoma mortality in 31 countries from 1985 to 2015*. British Journal of Dermatology, 183(6), 1056–1064. https://doi.org/10.1111/bjd.19010