Isla Hume – Life Science
Abstract
The impressive ability of plants to produce oxygen can potentially be amplified through the selection of wavelengths to support life on long-term space missions. Three trial groups of Pogostemmon erectus were grown under white (400-700 nm) and red-blue (425-495 nm, 620-720 nm) light as well as in the dark. Data was collected on the changes in dissolved oxygen and considerable loss was observed for every group. There was no significant change in photosynthesis between the Red-blue and White groups, however, some changes must be made to the experimental setup to achieve reliable results.
Introduction
Plants helped create our world through ecological succession and their life-giving talents can help us explore the deeper mysteries of space. Currently, astronauts receive their oxygen from electric systems such as electrolysis (Marshall 2017). Plants could become an alternate source of oxygen if only their rate of photosynthesis could be increased. This investigation aims to research the changes in the photosynthetic abilities of a vascular aquatic plant species, Pogostemon erectus, when grown under red-blue (450-495, 620-700 nm) combination light.
Ecological succession is the process in which an ecosystem develops over time. Life on Earth first began in the Hadean eon (4 Ba) (Walker et al. 2022), but it took another 3,530 million years for plants to make it on land and start transforming the Earth. These plants were responsible for the mid-Paleozoic (250-540 Ma) oxygenation event that pushed global O2 levels way up (Lenton et al. 2016).
Photosynthesis is a powerful, naturally occurring reaction that allows for life. It is a light-based reaction (Lambers et al. 2024) meaning that changes in wavelength and irradiance will have different effects on its efficiency. Previous research mainly focused on the effects of blue light (380-500 nm) on microscopic photosynthetic life (Forster et al. 1994), leaving a gap in data involving vascular plants. Research has shown that, in brown algae, blue light stimulates photosynthesis, a phenomenon that is not present in other taxa (e.g. green and red algae and one type of seagrass) (Forster et al. 1994). These preferences are determined by the concentration of photosynthetic pigments stored in the two photosystems which are determined by the plant’s genetics. Photosystems contain chlorophyll and protein molecules and run the photosynthetic process. Photosystem I (PSI), containing chlorophyll a, can absorb up to 720 nm (far red light) and Photosystem II (PSII), containing chlorophyll a and b, can absorb up to 690 nm (red light) (Rukes 1994). In general terms, 420-480 nm (blue light) and 670-690 nm (red light) are the best for light absorbance and photosynthetic yield (Rukes 1994). When considering this data, choosing red and blue combination light for this experiment should produce the best results by exposing the plants to light they can easily absorb and utilize.
When choosing between plants completely submerged in water and those with leaves emerging from water, two criteria were considered. On one hand, emergent plants release oxygen directly into the atmosphere, which would be good for a production system, but their structure also causes them to deplete the oxygen in the surrounding environment through extensive respiration (Caraco et al. 2006). This respiration leads to a lower net primary production (NPP), meaning the total amount of oxygen produced is low. It would also not be feasible to measure oxygen released into the atmosphere for this study.
Understanding the overlapping aspects of this endeavor is necessary to develop sustainable, biological life-support systems. To maximize the photosynthetic output of plants, wavelengths of light must be accurately calibrated to fit the absorbance and photosynthetic levels of each plant. On average, blue and red light are the most effective in these categories, making them excellent starting points for experimentation. However, the optimum sections of the visible light spectrum differ amongst organisms as their genetic composition may change the efficacy of their photosystems. Therefore, more research is necessary to improve current models. This research will aim to expand on each of these areas of knowledge, leading to the possibility of longer-term space travel.
Materials and Method
Pogostemmon erectus was purchased from Tropica 1-2-Grow! and was rinsed in cold tap water before being placed in a beaker filled with tap water. Each segment was removed from the other with exceptions being made if they shared a root system. No group had more than two thin segments. Each segment was approximately 4 centimeters long. 110 mL plastic tubes (iplusmile) were filled 82.5 mL of nutrient substrate (Fluval Stratum) before the plant was added. Once the plant was secured in the substrate the tube was slowly filled with cold tap water. The tubes were filled slowly to prevent cloudiness that would alter results. Each individual system was labeled 1-3 for data collection. Red, blue and white boxes (Ikea) were lined with duct tape along the edges before having an LED light strip (Aura LED) run along the lines. These colors were chosen as they would reflect rather than absorb the wavelength of the light inside leaving the plants with as much as possible. Lights were placed in a ring on the bottom, continued up one side and formed a ring on the top edge of the box. The lights were set to white and magenta (50/50 red and blue LEDs) on the RGB scale (red, blue, green). The blue box was left without light as it is the negative control. The blue box was tested for darkness by taking photos under different light conditions and required duct tape lining on one corner to complete block light. Plants were left in tubes under lights for 165 hours between measurements. The water was replaced each week to replenish the dissolved oxygen (DO) and was re-measured using the Vernier Go Direct optical DO probe.

Figure 1. Final experiment setup for the Dark group. This setup was replicated for the White and Red-blue groups.
Results
As shown in Figure 2, the Red-blue group was the most consistent and the Dark group tended to lose the most of its DO. When comparing the overall average of the data in Figure 2 we see that the White and Red-blue groups were near identical at 14.12 and 14.32 percent respectively (Figure 3). The Dark group lost considerably more at 17.19%. As seen in Fig 4, groups Red-blue and Dark both exhibited visible changes. Trial 1 from Red-blue grew an offshoot and all the trials from group Dark began to die in the third week (Figure 4).

Figure 2. A comparative graph showing the average percent decrease in dissolved oxygen across experimental groups over one week. The average taken was the mean percent change. (450-495, 620-700 nm is the Red-blue group and 400-700 nm is the White group. X represents the wavelengths affecting the systems in the Dark group which do not include visible light.)
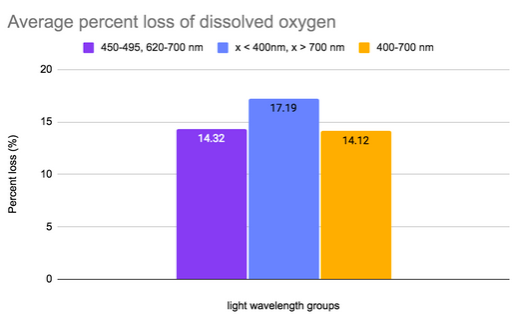
Figure 3. A comparative graph which shows the average percent loss of dissolved oxygen across all there trials. The mean was taken from the three groups of each wavelength.
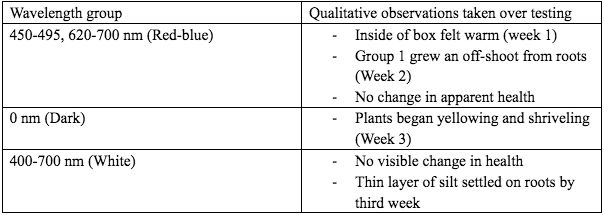
Figure 4. Table showing qualitative observations taken over three weeks of data collection.
Discussion
Generally, the Dark group was the only one that adhered to expectations. As seen in Fig 3, Dark lost the most dissolved oxygen. This was an expected result as, without light, the plant cannot photosynthesize and was forced to draw oxygen from its environment. It also began the slow process of decay as seen in Fig 4. This was a long-awaited result as it took longer than expected to begin dying. As decay requires oxygen, this would also add to the loss seen in Fig 3. This plant’s slow decay may show its capacity to adapt to a low-light environment, as it acquired oxygen via absorption through water when photosynthesis was not possible. This outcome should not have occurred in the other two groups as they had available light to process. This negative control performed properly and gave insight into possible changes occurring in the other two groups.
In the Red-blue group there was one expected result which was accelerated growth. As red light encourages growth (Kirschbaum 2011), there was an expectation of more visible development like the off-shoot (Fig 4). While this result made sense, what was more contradictory was that its environment continued to lose DO rather than showing signs of the increase in photosynthesis that would be necessary to support faster growth (Kirschbaum 2011). As the plant would need more adenosine triphosphate (ATP; the energy used by living things) to be able to grow, presumably the rate of cellular respiration had increased but it was running on oxygen drawn from the surrounding water rather than what it was producing itself. While this added growth did not raise rates of photosynthesis, it did affect the percent loss of DO (fig 2). Further research should be done on why the plant turns to DO instead of photosynthesis as the source for the nutrients it needs to grow.
As seen in Fig 2 the White groups had the most inconsistent results over the three weeks. This discrepancy was unexpected as the experiment setup was designed so that all groups would have equal exposure to light which should account for changes in temperature as well. One part of the experimental setup that could affect the DO is the water-to-substrate ratio. It’s possible that in certain groups the plants had more space as there was less substrate which would lead the plants to lower the dissolved oxygen even more (EPA 2024). As all the groups were exposed to the same amount and wavelength of light, this result is more a reflection of a confounding variable than the controlled variable and a conclusion cannot be drawn from the available data.
Another unexpected result was that the White and Red-blue groups demonstrated near identical results overall (Fig 3). While the range left out of the Red-blue exposure group is what the plant reflects, that should mean that the entirety of the light can be absorbed and utilized (Rukes 1994). It is possible that when combined with other stress factors such as a higher temperature or a new nutrient source (the substrate) the plant was affected in conflicting ways by these confounding variables. Another possibility is that the Red-blue light was still too much of the spectrum that the plants reacted as if it was nearly identical to white. If this is the case, research should be done on the effects of light from smaller intervals such as 620-700nm only. If these results reflect the controlled variable, it may be that Red-blue maintains the processes of these plants at regular levels and cannot be used to augment the rate of photosynthesis.
This experiment encountered many limitations regarding data collection. Possible factors that affected the results of the DO measurements are as follows; high plant-to-water ratio and too high of a temperature (EPA 2024). As discussed by the Environmental Protection Agency (EPA), a high ratio of vascular plants and/or algae to water can lead to a lower DO as it encourages higher rates of respiration that cannot be fully supported by photosynthesis. This phenomenon may offset the increases in photosynthesis that were expected. High temperatures were not previously considered as LED lights produce much less heat than compact fluorescent lamps (CFLs) and incandescent bulbs (USDE 2024) and they are also the only ones that could be programmed to produce custom wavelengths of light. While this problem was not expected nor entirely avoidable, warmer temperatures were noted at times (Fig. 4). Excessive heat can cause a lower DO as the gas gains energy and is released from the water. As the data is more indicative of the impacts from confounding variables from the experimental setup than the change in wavelength, it is inconclusive.
Changes to the setup must be made in future studies in order to take proper measurements. From this experiment it is hard to say what the proper size of container would be. In order to prevent extensive respiration in future research, testing can be done on the ideal container size to determine whether the plants would benefit from a full-size tank or if a 250 mL beaker would suffice. Warmth is something that can be moderated by a professional growth chamber but in a replica of this experiment it would be easier to reduce the number of LEDs/ft2 or increase the distance to the lights. Further research may also include experimentation to determine the amount of gaseous oxygen produced. This experiment would require a solute to be dissolved in the water to prevent the oxygen from dissolving and an air-tight pressure system would need to be established. While measuring changes in oxygen it may be beneficial to measure the net change over a long period of time as there may be a positive shift after two weeks that wasn’t visible at the one-week mark. There could also be research done on splitting wavelengths even further to have experimental groups of 620-700 nm (red) and 425-495 nm (blue) light separately. In order to develop a system fit for space there must also be data collected on the effects of microgravity on aquatic plants.
In conclusion, while there was some change observed, most can be accredited to flaws in the experimental setup. Certain changes must be made before this experiment can be repeated in a beneficial way, however, this study provides a foundational piece for greener space travel.
References
Caraco, N., Cole, J., Findlay, S., & Wigand, C. (2006). Vascular plants as engineers of oxygen in aquatic systems. BioScience, 56(3), 219-225. academic.oup.com/bioscience/article/56/3/219/333070?login=false.
Energy, Department of. “LED Lighting.” Energy.Gov, Department of Energy, 2024, www.energy.gov/energysaver/led-lighting.
EPA, US. “Dissolved Oxygen.” United States Environmental Protection Agency, Environmental Protection Agency, Feb. 2024, www.epa.gov/caddis/dissolved-oxygen#tab-5.
Forster, R.M., & M.J. Dring. (1994) “Influence of blue light on the photosynthetic capacity of marine plants from different taxonomic, ecological and morphological groups.” European Journal of Phycology, 29(1), 21–27, https://doi.org/10.1080/09670269400650441.
Kirschbaum, M. U. (2011)“Does Enhanced Photosynthesis Enhance Growth? Lessons Learned from CO2 Enrichment Studies.” Plant Physiology, 155(1), 177-124. http://www.ncbi.nlm.nih.gov/pmc/articles/PMC3075783/.
Lambers, Hans, and James Alan Bassham. “Photosynthesis.” Encyclopædia Britannica, Encyclopædia Britannica, inc., 1 Mar. 2024, www.britannica.com/science/photosynthesis.
Lenton, T. M., Dahl, T. W., Daines, S. J., Mills, B. J., Ozaki, K., Saltzman, M. R., & Porada, P. (2016). “Earliest land plants created modern levels of atmospheric oxygen.” Proceedings of the National Academy of Sciences, 113(35), 9704–9709, https://doi.org/10.1073/pnas.1604787113.
Marshall, G. (2017) “Environmental Control and Life Support System (ECLSS).” NASA, http://www.nasa.gov/wp-content/uploads/2020/10/g-281237_eclss_0.pdf.
NOAA. “How Much Oxygen Comes from the Ocean?” NOAA’s National Ocean Service, 2023, oceanservice.noaa.gov/facts/ocean-oxygen.html.
Rukes, K. L. & Mulkey, T. J. (1994) “Measurement of the effects of light quality and other factors on the rate of photosynthesis.” BIOSCENE, 20, 7-11. https://www.indstate.edu/cas/sites/arts.indstate.edu/files/Biology/bios20-3b.pdf.
Walker, J.D., and Geissman, J.W., compilers, 2022, Geologic Time Scale v. 6.0: Geological Society of America, https://doi.org/10.1130/2022.CTS006C.