Song Ha Nguyen – Life Science
Abstract
Locating at the end of the chromosome, one of telomere’s functions is to sacrifice its non-coded DNA base pairs to be cut off during DNA replication. For this nature, telomere is believed to be the underlying reason for cell aging and potentially one’s longevity as they shorten after each cell division until cells can no longer divide. Longer telomeres were found in frequent consumers of Omega-3 Fish Oil. Meanwhile, shorter regions were identified in alcoholics.
This controlled experiment was designed to be the first to deliberately impose alcohol, in form of cooking wine, and omega-3 into two groups of Drosophila hydei, to then identify and compare the effects they pose on the organism’s DNA. Each treatment made up 12% of a standard fruit fly’s media culture. The application of Beer’s Law in spectrophotometry was later used to show that the measured DNA light absorbance in the experiment is directly proportional to the number of DNA base pairs present, and ultimately, to draw connections with telomere shortening rate.
After a treatment period of 19 days, 30 randomly selected flies, including control flies, alcohol-fed flies, and omega-fed flies were extracted for DNA. Using the spectrophotometer at 500nm, mean DNA light absorbance from each group was calculated, where DNA of omega-fed flies had the highest mean absorbance of 0.045, followed by 0.044 of the control flies, and alcohol-fed flies had the lowest mean absorbance of 0.043.
The findings fell in the same patterns of past observational studies on healthy fatty acids and alcohol’s association with telomere length, though were not statistically significant.
Introduction
By increasing risks of cancer, obesity, and other chronic diseases, unhealthy diets are widely known for their negative impact on one’s longevity (Reeves et al. 2016). Yet, the most direct and primary consequence, unaware of by many, has been identified on a molecular level, where choices of diets can slow down, or speed up cell aging (Victorelli and Parssos. 2017).
Telomere- The Biological Aging Clock
Telomeres are non-coded, yet vital regions at each end of a chromosome. Due to the nature of DNA replication, a full chromosome can never be fully copied and must lose hundreds of ending base pairs Campbell Biology (Urry et al. 2020 ). By giving up their non-coded base pairs, telomeres ensure all genes that code for essential proteins are fully copied before mitosis (Urry et al. 2020). As a result, telomeres keep shortening after each cell division until cells eventually can no longer divide. The phenomenon has been hypothesized to be the primary molecular explanation for cells’ aging, or senescence, and accounts for the increase in vulnerability to disease in elders as cells in essential tissues can no longer be regenerated (Victorelli and Parssos. 2017).
Associations of Alcohol and Omega-3 Fatty Acids with Telomere’s Length
Telomere has become a highly researched area with an effort to extend human life expectancy. Observing individuals with high fatty acid levels has nominated omega-3 fatty acids to be a top candidate for maintaining telomere length (Farzaneh-Far R et al. 2010), whereas significantly shorter telomeres were found in individuals with high alcohol consumption (Topiwala et al. 2022).
Fruit Flies- Genetics Studies’ Favorite
Sharing over 60% of genes in common with humans and possessing telomeric regions in their chromosomes make Drosophila hydei (D. hydei) an appropriate human-model system (Wangler et al. 2015). Since telomeres’ size can be challenging to study, quantifying DNA’s overall length is a more possible approach.
Hypothesis and Objective
This project aims to compare DNA size of omega-3-fed fruit flies and cooking wine-fed fruit flies. This is to explore the potential effects of healthy fatty acids versus alcohol on D. hydei’s telomere shortening rate.
Alternative Hypothesis: There is a statistically significant difference in DNA light absorbance between the omega-fed flies and alcohol-fed flies, in which the Alcohol group’s light absorbance will be smaller.
Null Hypothesis: There is no relationship between diets and DNA size, and any observed differences are due to variances in fly samples.
Materials and Method
I. Setting Up
A week before the experiment, D. hydei culture purchased from Aquarium West started off with around 30 adult flies and many pupae. The required amount of 135 flies for the main experiment was reached after 7 days of fruit flies’ rapid reproduction.
1. Preparing Culture Media
Control media
18g of Repashy Superfly culture media were added to 3 labelled media bottles of Control, Omega-3, and Alcohol, respectively. Following, 50mL of warm tap water was added into the Control-labeled bottle and mixed well with the Repashy powder until no crumbs remained.
Treated media
While the same is done for the Omega-3 and Alcohol labelled bottles, only 44mL of warm tap water was added. 6 mL of Omega-3 supplement from NutraSea was then poured into the Omega-3 labeled bottle and was mixed thoroughly with the previous standard culture media mixture. Similarly, 6 mL of Shaoxing cooking wine from Double Happiness was added and mixed with the previously prepared mixture in the Alcohol-labelled bottle (Figure 1).
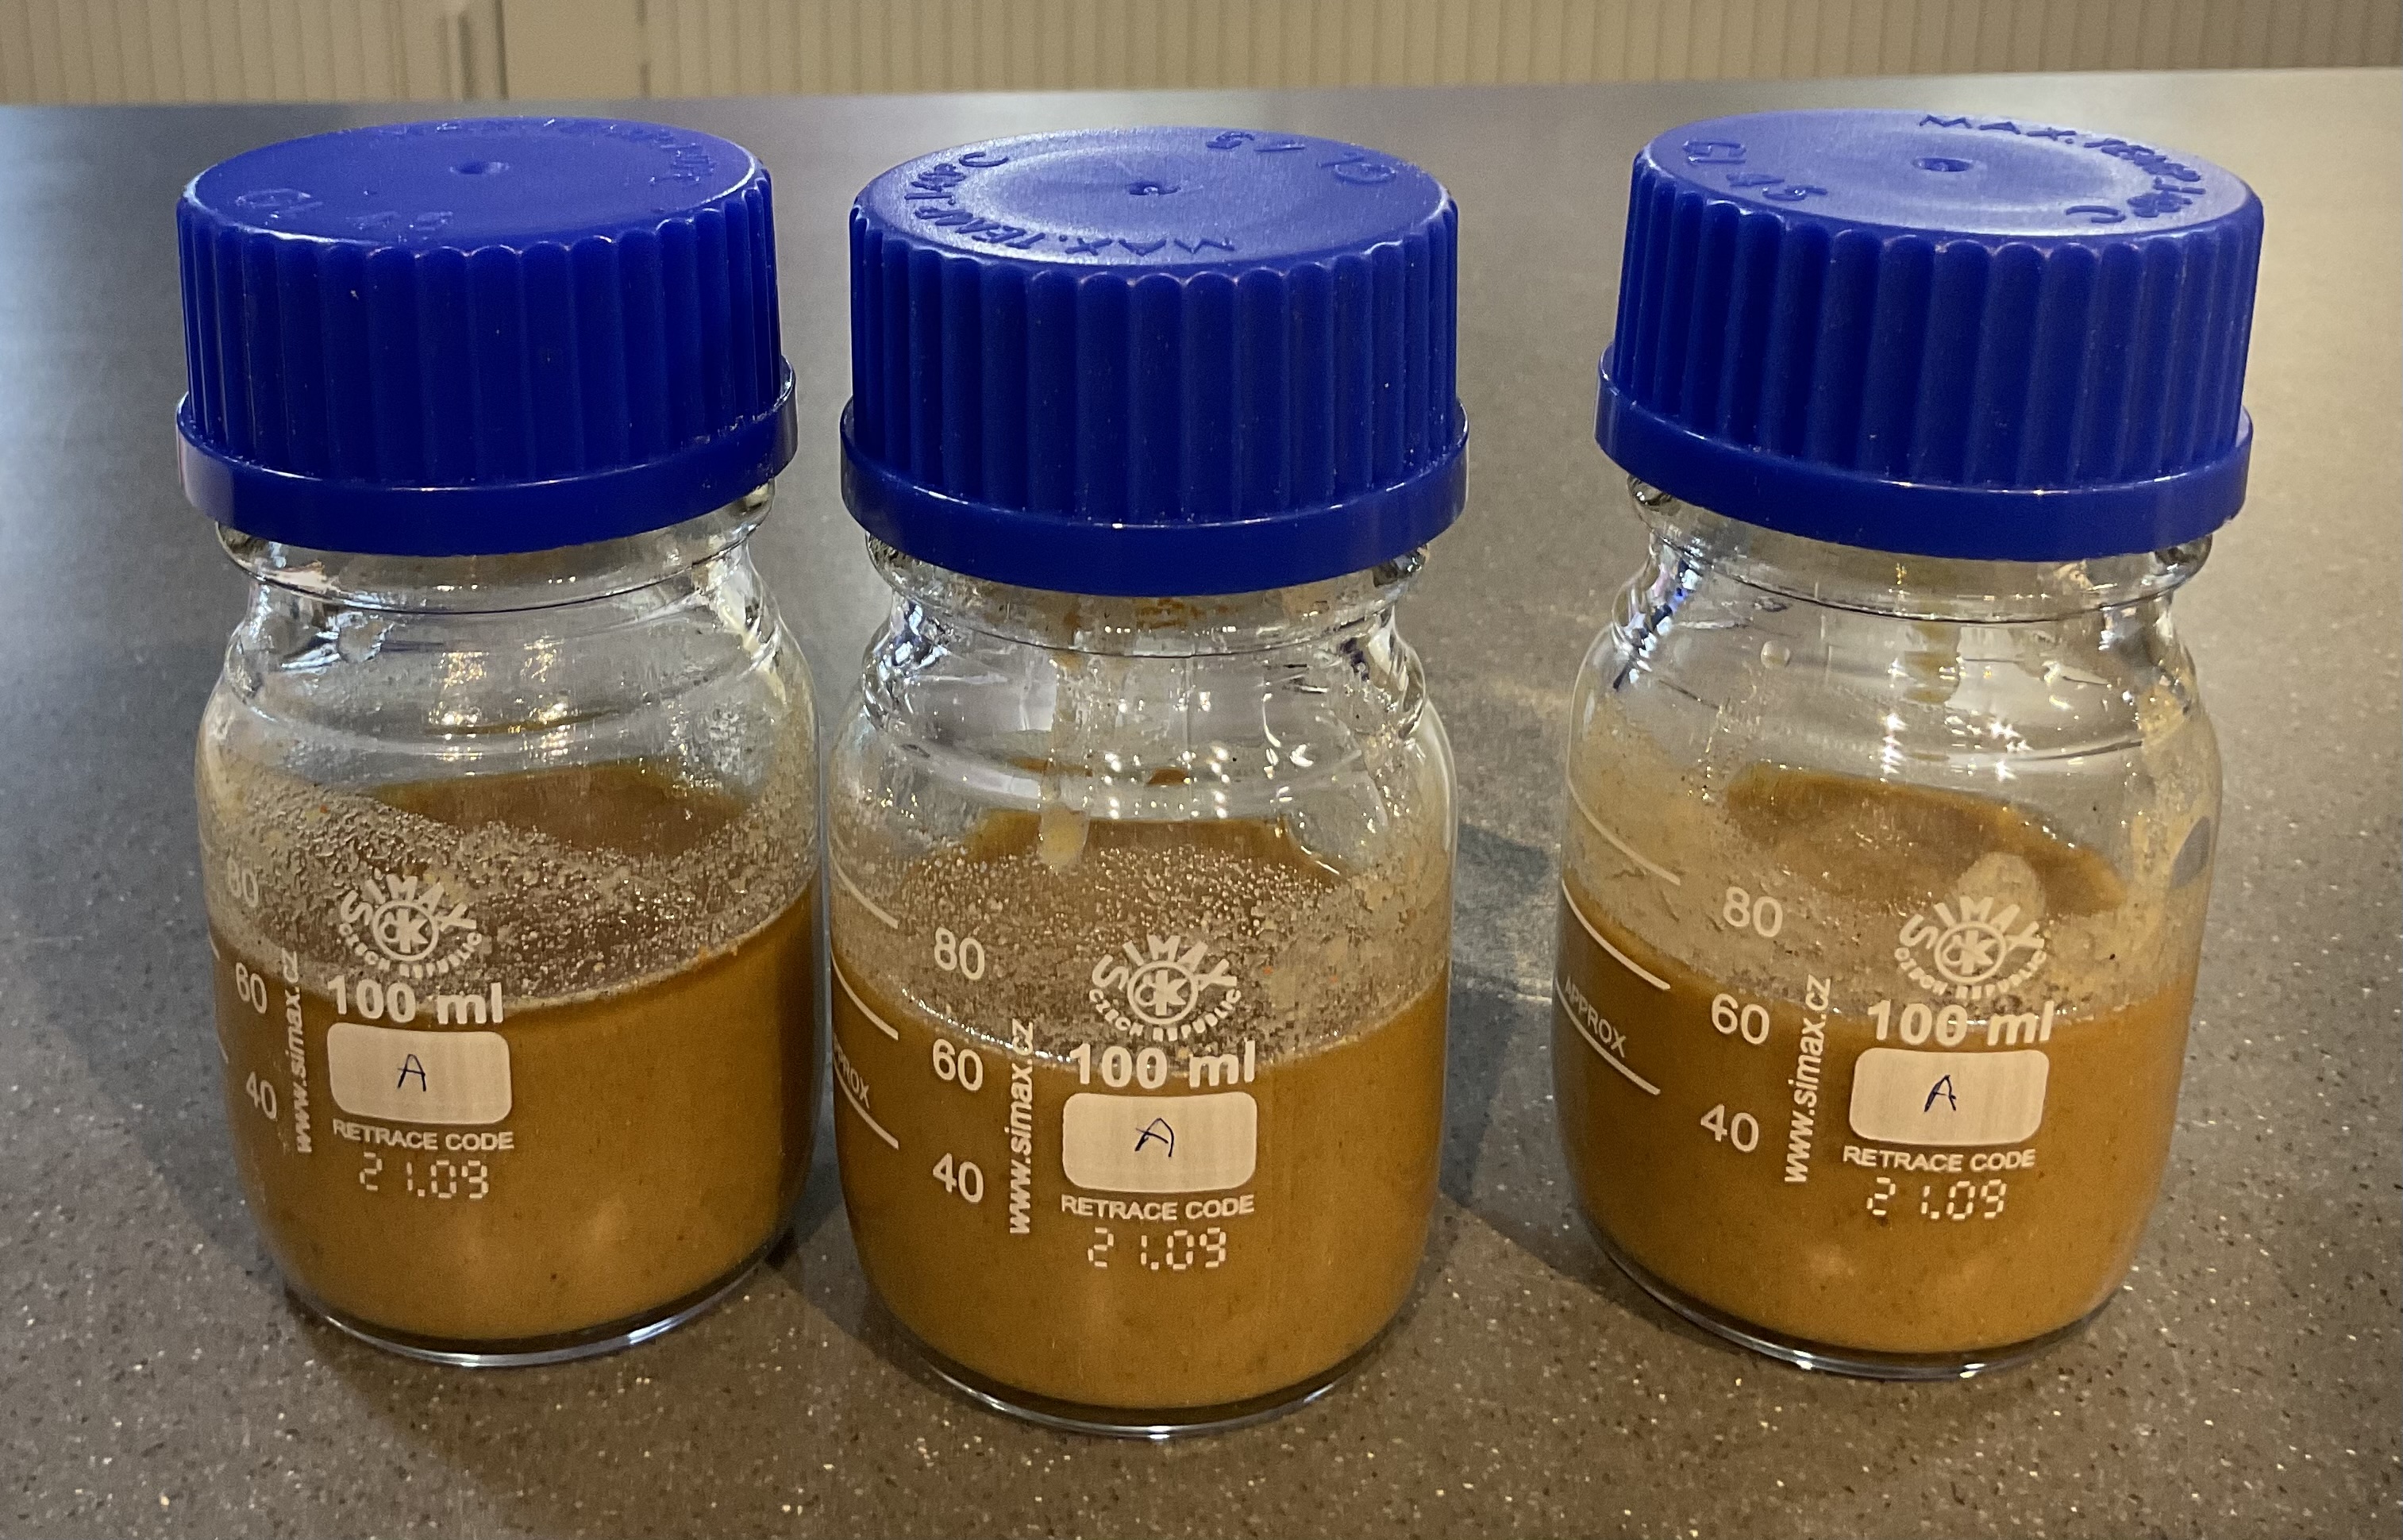
Figure 1: Three media cultures for 3 replicates of alcohol-treated flies. Both control and treated media bottles have a total volume of 50mL. The 6mL of added treatment accounts for 12% of fruit flies’ food.
2. Building New Culture and Imposing Treatments
Starting off, 9 large plastic cups were prepared, in which 3 were labeled “Omega I, Omega II, Omega III” respectively, and another 3 with “Alcohol I, II, III” labels, the remaining 3 were each labeled “Control I, II, and III”. The same labeling rule was done on 9 coffee filters that serve as the lids. The three prepared omega-3- culture media were each then added to the bottom of three different omega-labeled plastic cups, while cooking wine-containing media were added to the bottom of the three alcohol plastic cups. The control-labeled plastic cups were filled with the prepared control media, ones with no imposed treatments. Furthermore, to provide a solid base for flies, another coffee filter was folded into a fan shape and submerged into the bottom media of each plastic cup. In addition to this, a few shredded wood wools are added to build a standing base. In the final step, 15 randomly selected fruit flies from Aquarium West’s original culture were added to each of the 9 plastic cups. Immediately after flies were added to each group, the previously labeled coffee filter, acting as a lid, was used to wrap up the cup’s mouth with a rubber string.
The 9 groups were left for 19 days at room temperature and natural lighting (Figure 2).
About 1 week and 5 days after treatments first imposed on flies, 7.5mL of water was added to each group’s media via a medicine dropper for hydrating purpose (Figure 3).
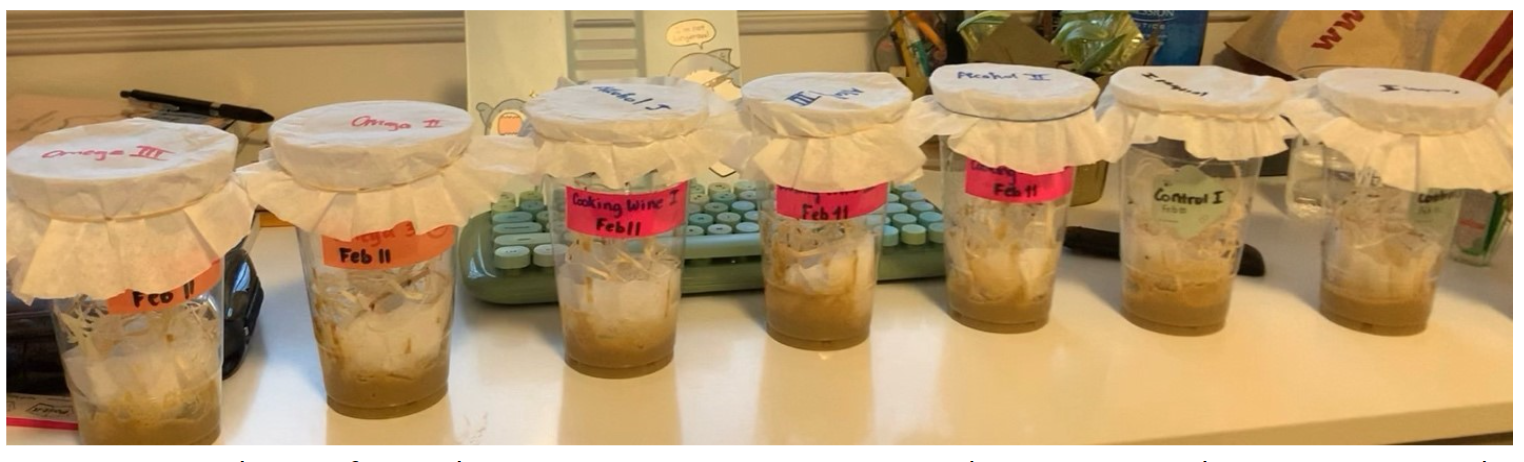
Figure 2: 3 replicates for each treatment; 3 Omega-3 treated groups, 3 Cooking-Wine-treated groups, and 3 control groups (9 in total). Each group had 15 flies. Later, 10 randomly selected files from each treatment, including the control were studied.
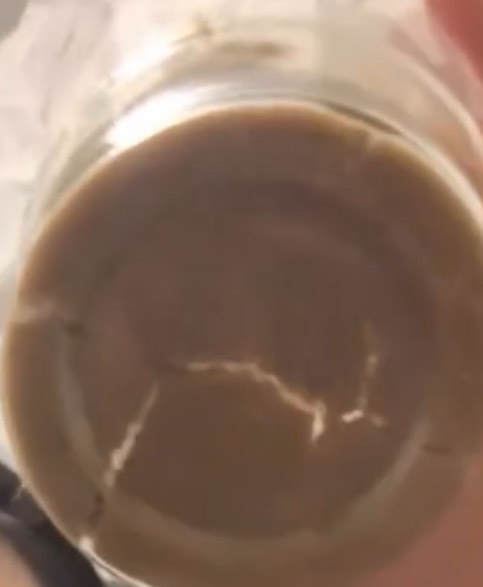
Figure 3: Bottom of Omega-3 treated fruit flies’ dehydrated culture media after 1 week and 5 days. After hydrating, more flies comfortably crawled onto the media surface.
II. Data Collection
After 19 days, 30 flies were randomly selected for collection. Therefore, the sample size is n=10 for each of the two treatment groups, and for the control group.
1. DNA Extraction
30 – 1.5mL pipette tubes from miniPCR were prepared, 10 were labelled O for Omega-3, another 10 with A for Alcohol, and the remaining 10 with C for Control. 25 µL of DNA buffer was pipetted into each tube. Each of the 30 selected flies from 3 groups was added to the treatments labeled tubes accordingly. With a pipette tip, each fly was grinded forcefully for 1 minute and 15 seconds, till the solution became dull white (Figure 4). An additional 25 µL of DNA buffer was added to each tube at the end.
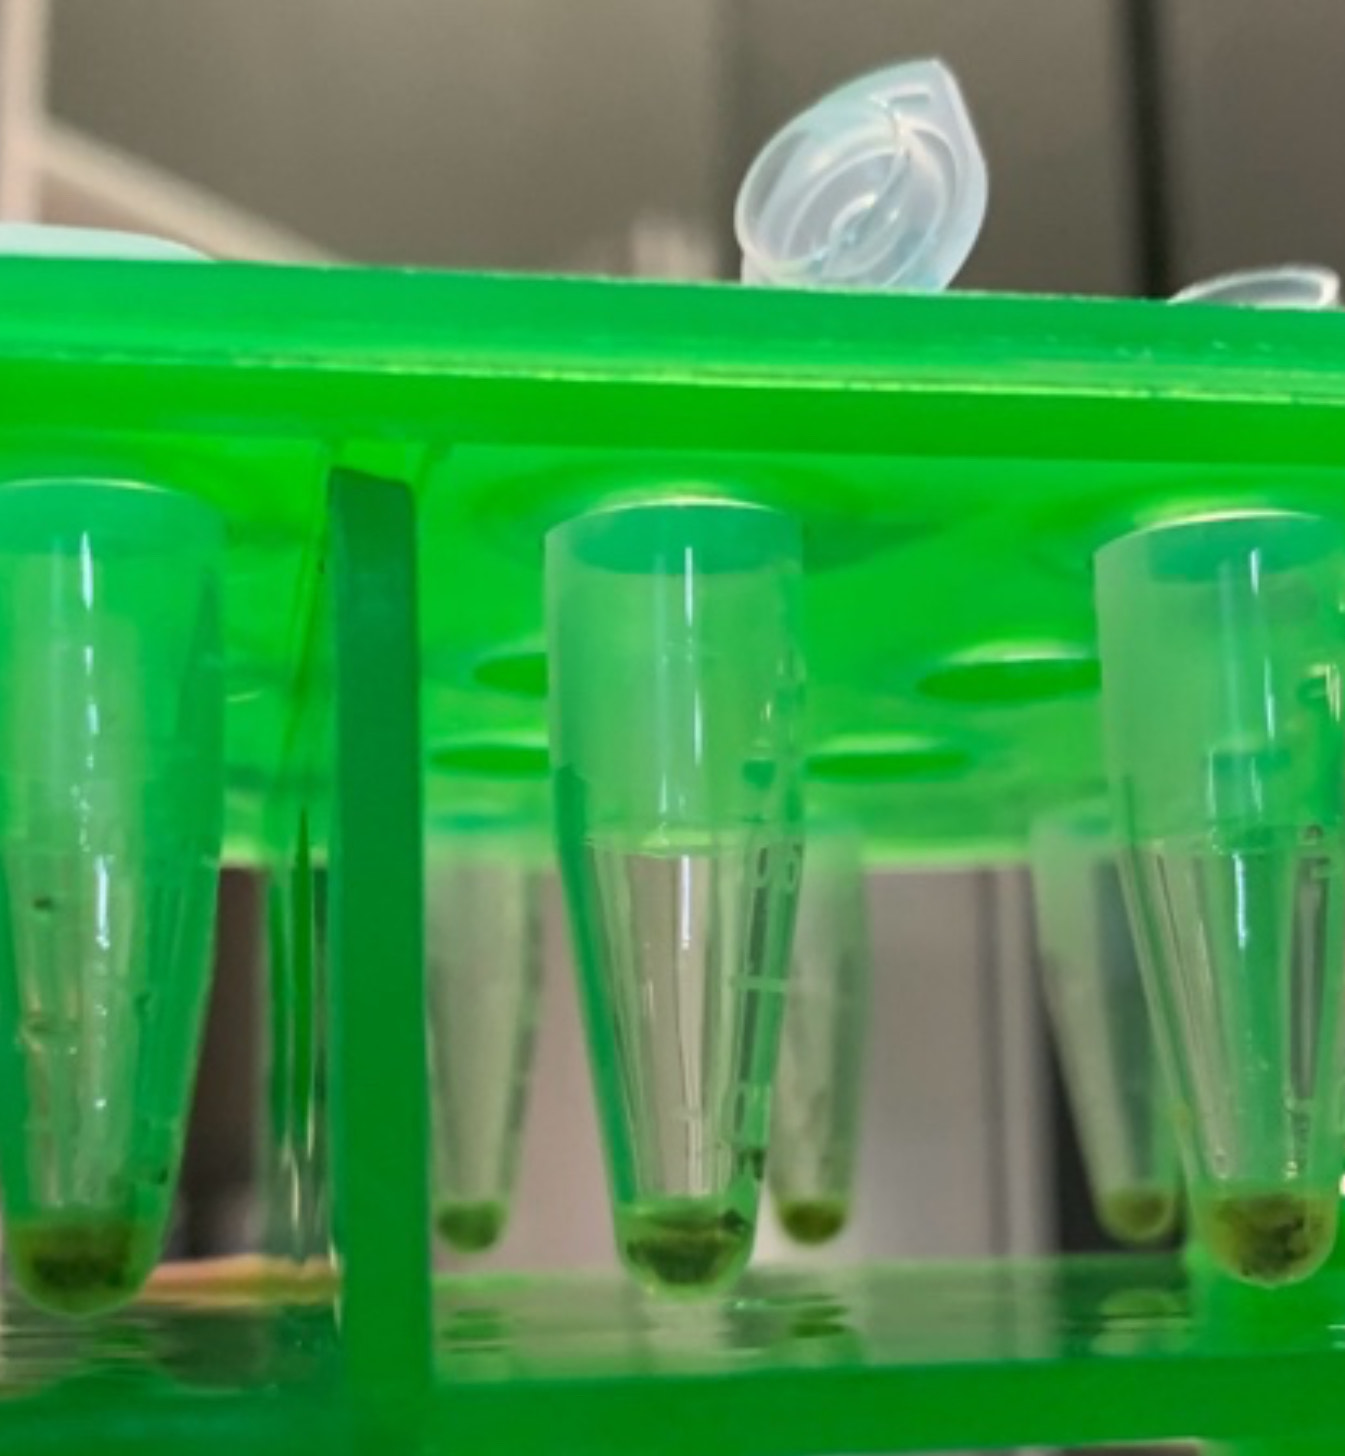
Figure 4: Dull-white Solution Consists of Grinded Fly Sample and DNA Buffer
2. DNA Incubation and Centrifugation
Before extracted DNA can be incubated in the miniPCR heat block, extracted DNA samples including flies’bits were transferred into smaller labeled miniPCR pipette tubes, appropriate for fitting into the heat block.
All 30 extracted DNA samples were incubated at 95°C for 10 minutes and centrifuged for 25 minutes.
3. DNA Measurement
As instructed by the supplier, the spectrophotometer from Fisher Science Education was turned on 15 minutes prior to use. A wavelength of 500nm was selected. In the meantime, 3uL of DNA loading dye from miniPCR was added to each of the 30 pipette tubes containing flies’ extracted and incubated DNA.
30 cuvettes were then prepared, of which 10 were labelled C for Control, another 10 with A for Alcohol, and the remaining O with C for Omega. 2197uL of distilled water was added into each cuvette, and 53uL of each DNA sample, which was previously dyed, was transferred from their pipette tubes accordingly into a cuvette with matching labels, bringing the cuvette’s total volume to 2250uL.
Into a separate non-labeled cuvette, a total 2250uL volume was also added with no DNA sample, in which 2247uL was distilled water and 3uL of DNA loading dye. This cuvette, as a control, was the first to be inserted. The spectrophotometer was calibrated to read the control cuvette as 0 absorbance. Following, 30 DNA-containing cuvettes from Omega-fed flies, Alcohol-fed flies, and control flies, were inserted one by one, and absorbance at 500nm was measured and recorded. Cuvettes were wiped with Kim Tech Wipe prior to each insertion.
Results
Compared to non-treated samples, imposing healthy fatty acids on D. hydei increased their mean DNA absorbance, whereas imposing alcohol in form of cooking wine decreased mean DNA light absorbance in flies (Fig. 5).
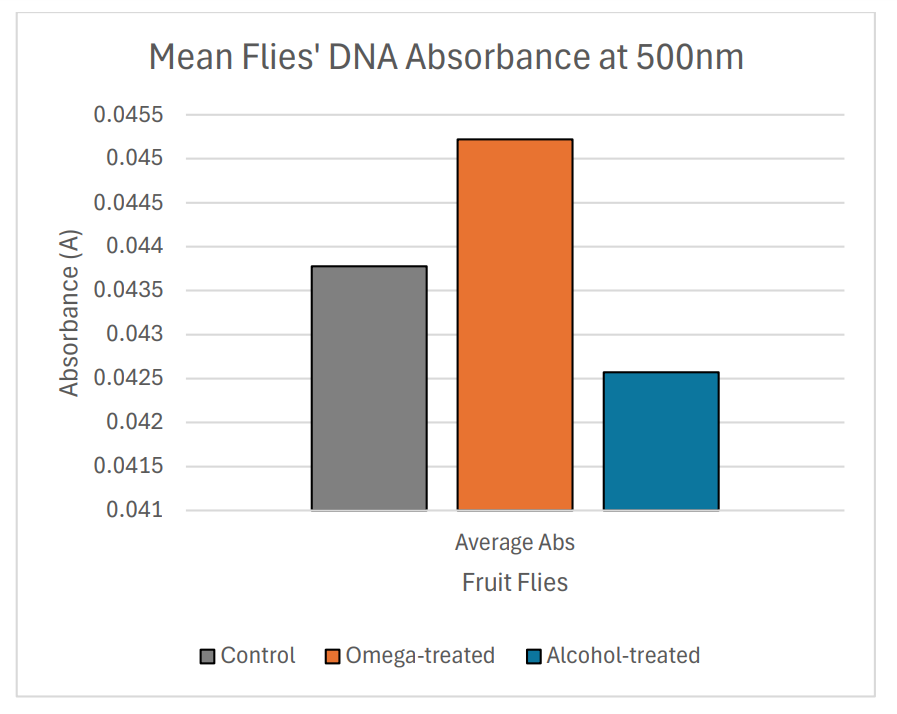
Figure 5: Non-rounded mean DNA absorbance of control and treated flies on bar graph.
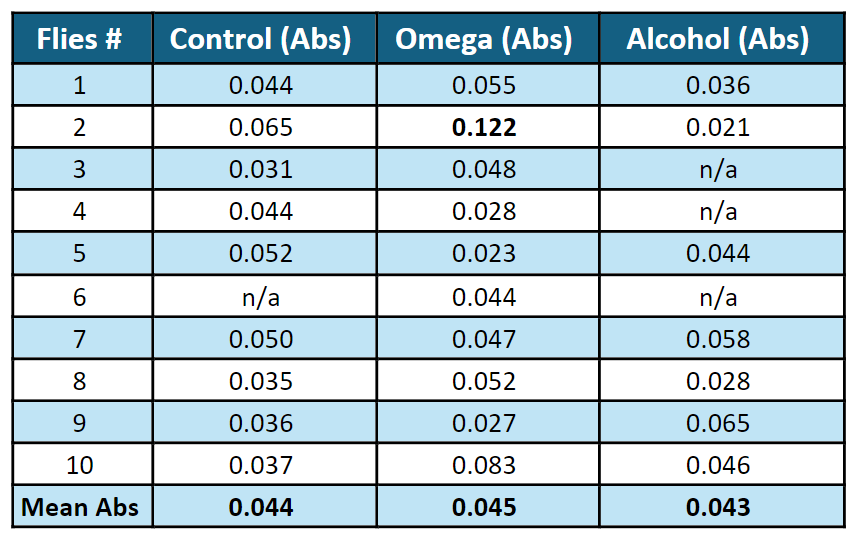
The spectrophotometer readings provided the highest mean absorbance of around 0.045 for omega-fed flies’ DNA and the lowest of 0.043 for alcohol-fed flies (Table 1). Serving as a baseline for comparison, DNA from the control group whose media receives no treatment has a mean absorbance of around 0.044, between the mean absorbance of DNA from omega-fed group and alcohol-fed group.
Table 1: Raw data of absorbance readings of flies’ DNA, Omega-3-fed flies at 500nm. Note that fly #2 from Omega 3 group (bolded) is an outlier and is omitted from calculations.
Discussion
Deeper Dive into Results
Since at 500 nm, the absorbance was greatest for DNA of Omega-3 fed fruit flies (0.045) and lowest for DNA of fruit flies that fed on Cooking Wine (0.043), this suggested that DNA content was more concentrated, or more base pairs were presence, in the former sample than in the latter, and thus absorbing more light.
However, since the calculated F-value (0.00011) is smaller than 1, there is no statistically significant difference between the mean DNA absorbance of the 2 treated groups and the control (Table 2). Therefore, there was not enough evidence to show a relationship between diet type; omega-3 and alcohol, and DNA’s size and fail to reject the null hypothesis.
Table 2: Analysis of Variance Test (ANOVA) shows the differences in the 3 mean DNA absorbances are statistically insignificant.

Though not statistically significant, in general, similar-in-trend results were obtained on D. hydei, the project’s chosen human-model system, where Omega-3 fatty acids possessed the same tendency to potentially maintain longer DNA length, while alcohol appears in some way shortening the DNA molecule.
Limitation and Source of Errors
Efforts were made to keep all data collection methods between 2 groups of treatments and 1 control group consistent throughout the study, so that any effects observed on DNA absorbance rate, thus concentration, can fully be attributed to the different treatments in fruit flies’ media culture. There were, however, a few limitations that prevent the project from reaching this solid conclusion.
1. Non-purified DNA
First, the extracted DNA was not purified. Before inserting samples into the spectrophotometer, insects’ solid bits were avoided as DNA samples were being pipetted into its cuvette. However, microscopic impurities cannot be avoided and may overestimate the absorbance reading.
This can be seen from a practice trial with a different data collection method, where 25ul of unpurified and unamplified DNA samples in DNA buffer were run over gel electrophoresis. This results in long and smeared bands of DNA, instead of ideal discrete bands (Figure 6). Contamination is found to be a common reason for this, and given that DNA was not purified, this is entirely plausible.
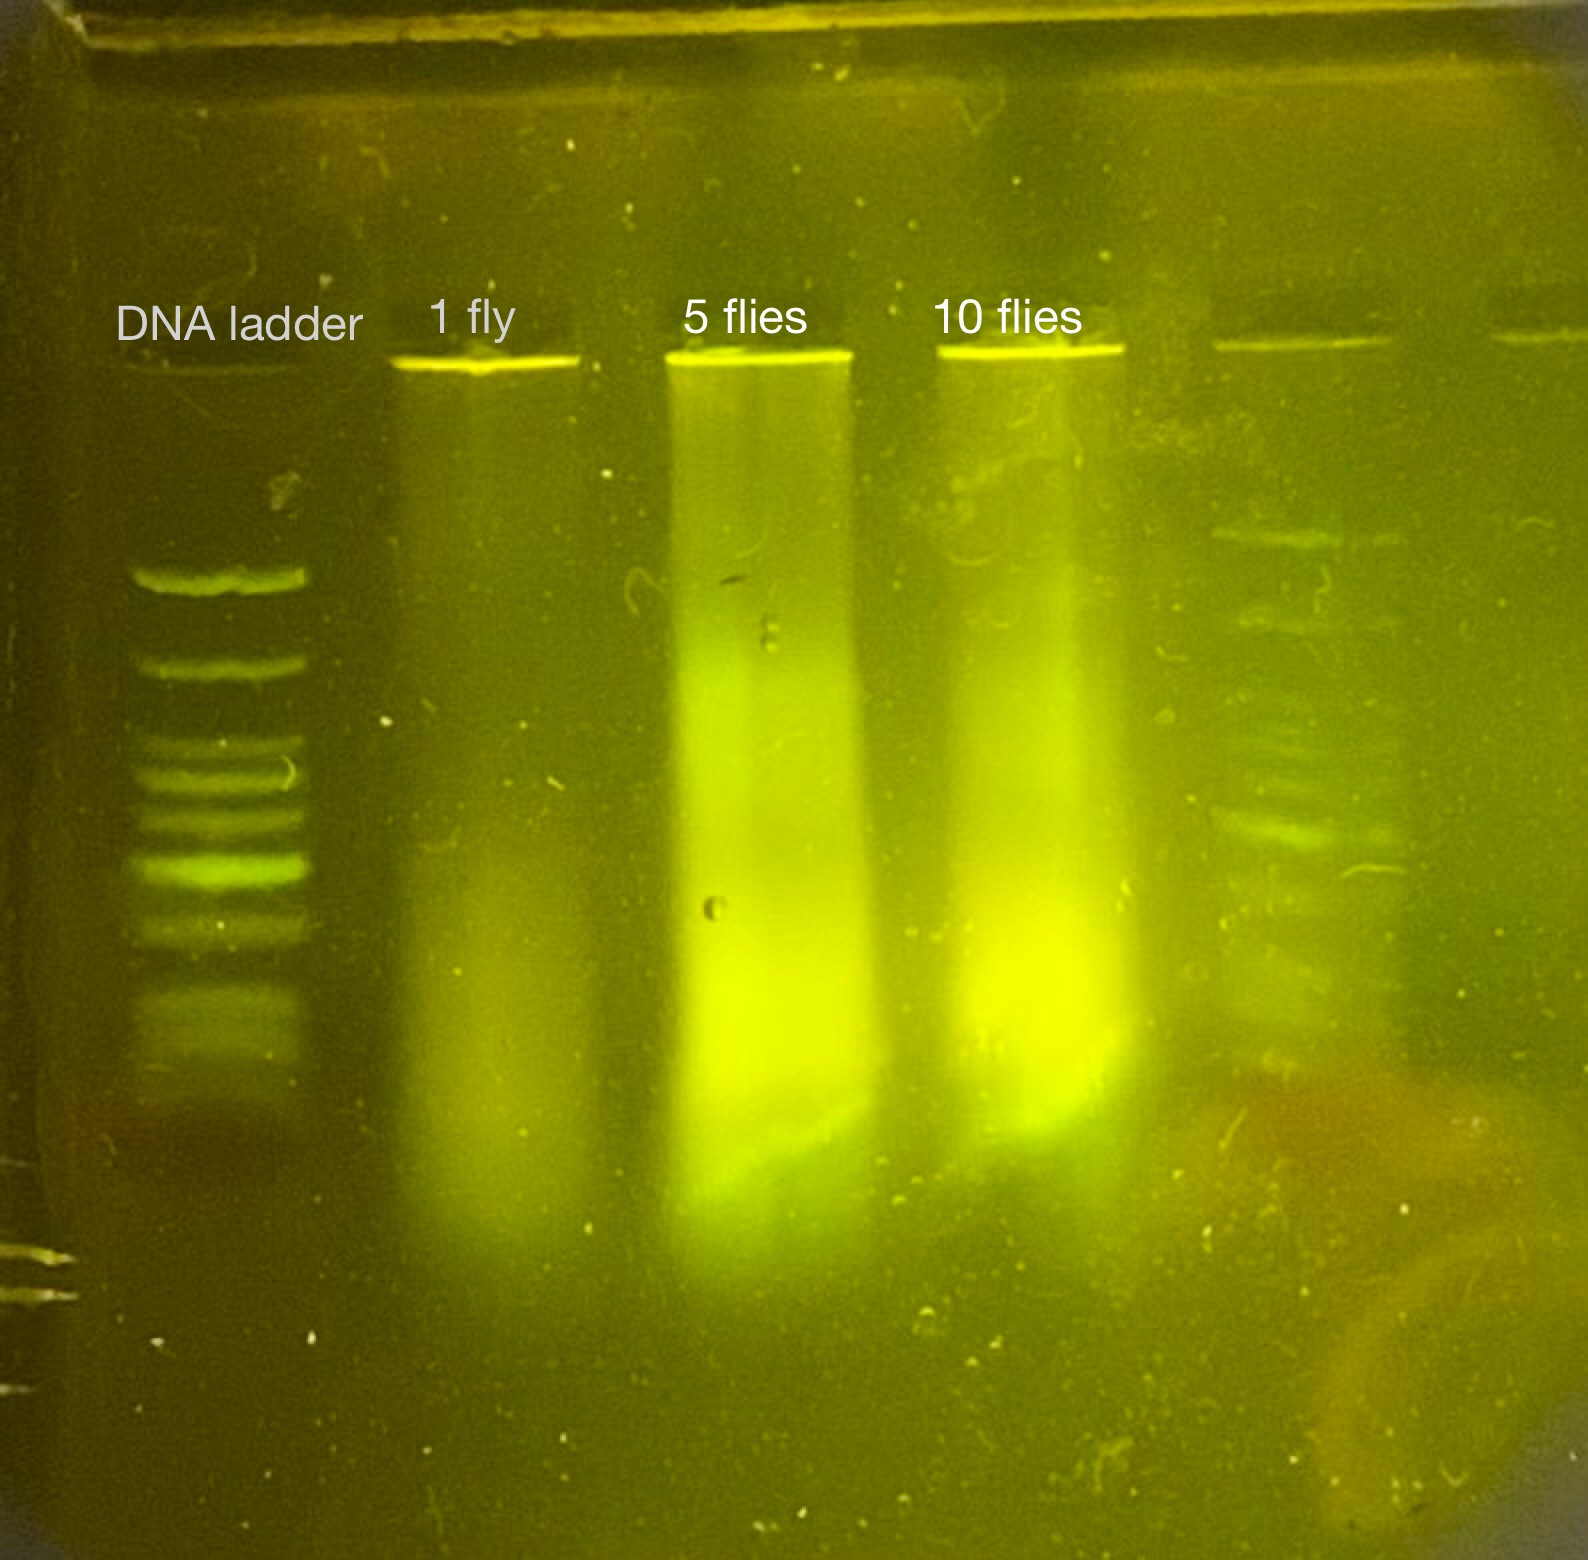
Figure 6: Fly’s DNA samples on Gel Electrophoresis from a practice trial, long-spread and smeared bands were likely accounted for by other non-DNA impurities.
2. Flies’ preference over alcohol
During the feeding period, it was observed that when the container was shaken, flies in alcohol group remained crawling on the bottom where their treated media was placed, meanwhile flies in omega group immediately crawled up, away from the omega-containing media. Moreover, after data were collected, new eggs were found to be laid and hatched into flies in alcohol-fed groups. Meanwhile, all Omega-fed flies that were not selected for DNA extraction eventually died off after 3 weeks with no offspring reproduced. Both observations suggest fruit flies tend to prefer an alcohol-containing environment to an omega-containing one. Additionally, a study that was made aware before this project was conducted, found that fruit flies can possess behaviors of alcoholics when exposed to unlimited alcohol source (Chvilicek, Titos and Rothenfluh. 2020).
Whether or not this bias made fruit fly a less, or a more accurate human-model system is unanswered in this project. However, its possibility to interfere with the experiments’ results was not unexpected.
3. Unamplified DNA
Unlike other DNA quantification methods that use PCR amplification, the DNA extracted from this project was not amplified due to the lack of primer. Since the project’s objective was to quantify an overall DNA length, finding a primer for fruit flies’ entire genome was challenging. Therefore, the project’s full vision of the effects of Cooking Wine and Omega-3’s diet on D.hydei’s DNA’s length may be limited by an insufficient amount of DNA collected and studied.
4. Procedural Errors
i) Fly No.2 from Omega-fed Group, the Outlier
It was later observed that the cuvette containing omega-fed fly No.2 ’s DNA was stained with a long dull white stripe (Figure 7). This most likely accounts for the fly’s dramatically high DNA absorbance, given that the stain was directly on the transparent side of the cuvette, where light beams pass through in the spectrophotometer (Table 1).

Figure 7: Dull-white stained on the left side of one transparent surface (squared area) of the empty cuvette that held DNA sample of Omega-fed fly No.2, which was not able to be removed by Kimtech Wipes. Note that none of the remaining cuvettes possess significantly large-in-area stains.
ii). Inadvertent Smaller Sample Sizes
Non-available (n/a) absorbances from Table 1, were accounted for by an escaped fruit fly during DNA extraction, and 3 flies DNA samples that were spilled as cuvettes were being prepared. These procedural errors reduced the sample size from 30 to 26 flies.
In the future, larger sample sizes, such as 90 flies, instead of 30, can be conducted to increase the reliability of collected data, as protocols presented in Materials and Methods are still practical for such large sample sizes. Furthermore, a larger sample size tends to result in a larger F-value in the ANOVA Test, by increasing the variance between groups. This can gather sufficient evidence to reject the null hypothesis.
A Call for Future Studies
Albeit telomere is the only region that can shorten on a DNA molecule, knowing for sure whether or not these changes occurred at D. hydei’s telomere region is beyond the scope of this project’s procedure. However, it would have made sense if it was flies’ telomere that changes, since telomere is extremely small, and the changes detected by the spectrophotometer appeared to be extremely subtle. Nevertheless, it is not possible to conclude the preceding assumption, as the project quantifies an overall DNA concentration instead of solely their telomere regions.
A call for future studies to find out whether these changes occur at the telomeres, the hypothesized molecular aging clock, is essential.
Conclusion & Project’s Message
Two and a half weeks is almost a full lifetime of fruit flies, effects of healthy fatty acids and alcohols on their genetic make-up is found to be apparent. Although the differences were not statistically significant, similar-in-trend results to previous observational studies were obtained on D. hydei, the chosen human-model system. Omega-3 fatty acids might have continued to maintain longer DNA, while alcohol might have shortened the DNA length. The mechanism that leads to these results is beyond the scope of the study.
That said, this project with future improvements poses a great tendency to serve as an evidential biological warning for long-term excessive alcohol consumption and its ability to bring negative impacts onto our cells’ molecular makeup.
Ultimately, as man is made of cells, understanding how what we intake interacts with our cellular world can help us adopt positive behaviors that benefit our health and take better care of ourselves. Factual biological finding is hoped to be an effective tool for individuals to convince themselves, and or their loved ones to maintain abstinence fromalcohol to a moderate consumption and start pursuing healthy diets containing high amounts of polyunsaturated fats such as Omega-3 fish oil.
Extending Trial
An extending trial to the project, substituting Omega-3 Liquid Supplement from Nutrasea with Pure Omega from a British company, Do Not Age, is currently in process. Most notably, a confirmation was made with the company’s representative, affirming slowing telomere shortening rate is one of Pure Omega’s benefits (Figure 8).
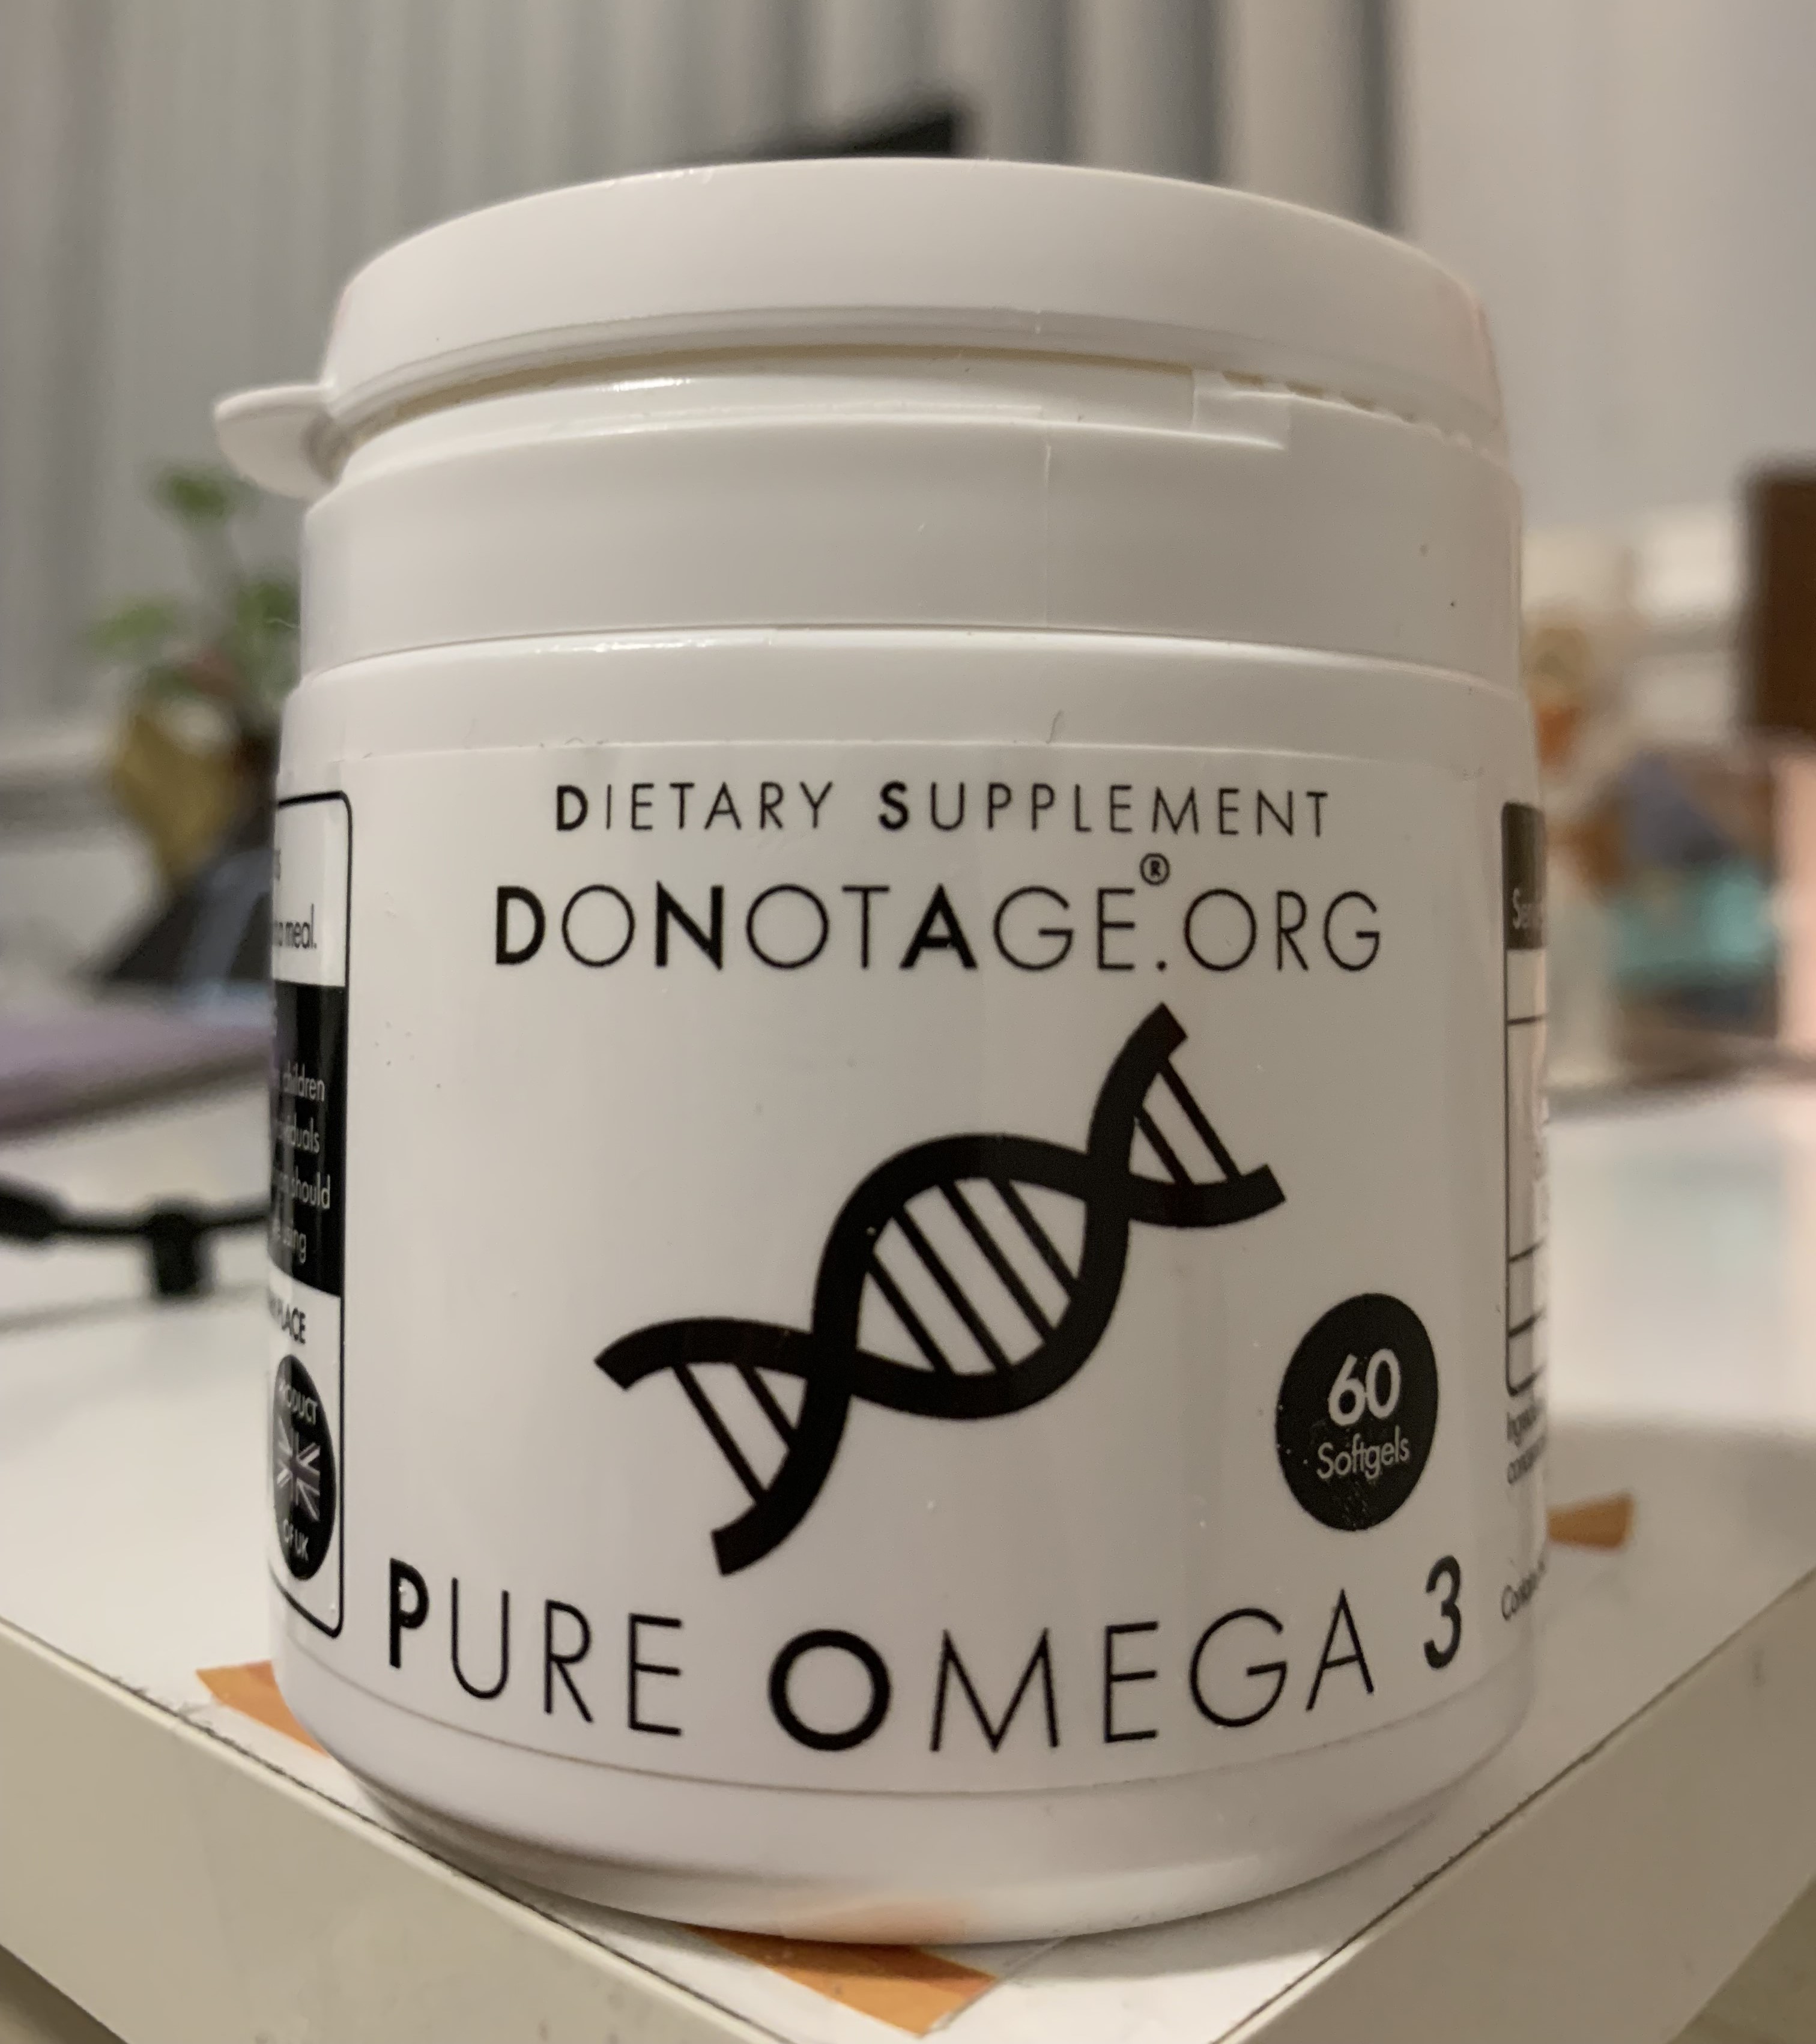
Figure 8: Pure Omega from Do Not Age
By approaching telomere region using omega-3, along with the company’s mission of extending human longevity on a genetics level, Pure Omega correlates perfectly with the project’s objective and was worthy of putting it to the test.
17, out of 20 flies, died 2 days after Pure Omega was imposed, with an identical procedure used for Omega-3 from Nutrasea. This outcome may imply that the purity and intensity of Pure Omega are significantly higher than Nutrasea’s.
Surprisingly, the 3 flies that did survive the new strong treatment were in healthy condition for an additional week unfortunately died off (Figure 9). However, this was likely due to a confounding variable which was believed to be the smell of labelling Sharpie ink on the lid.
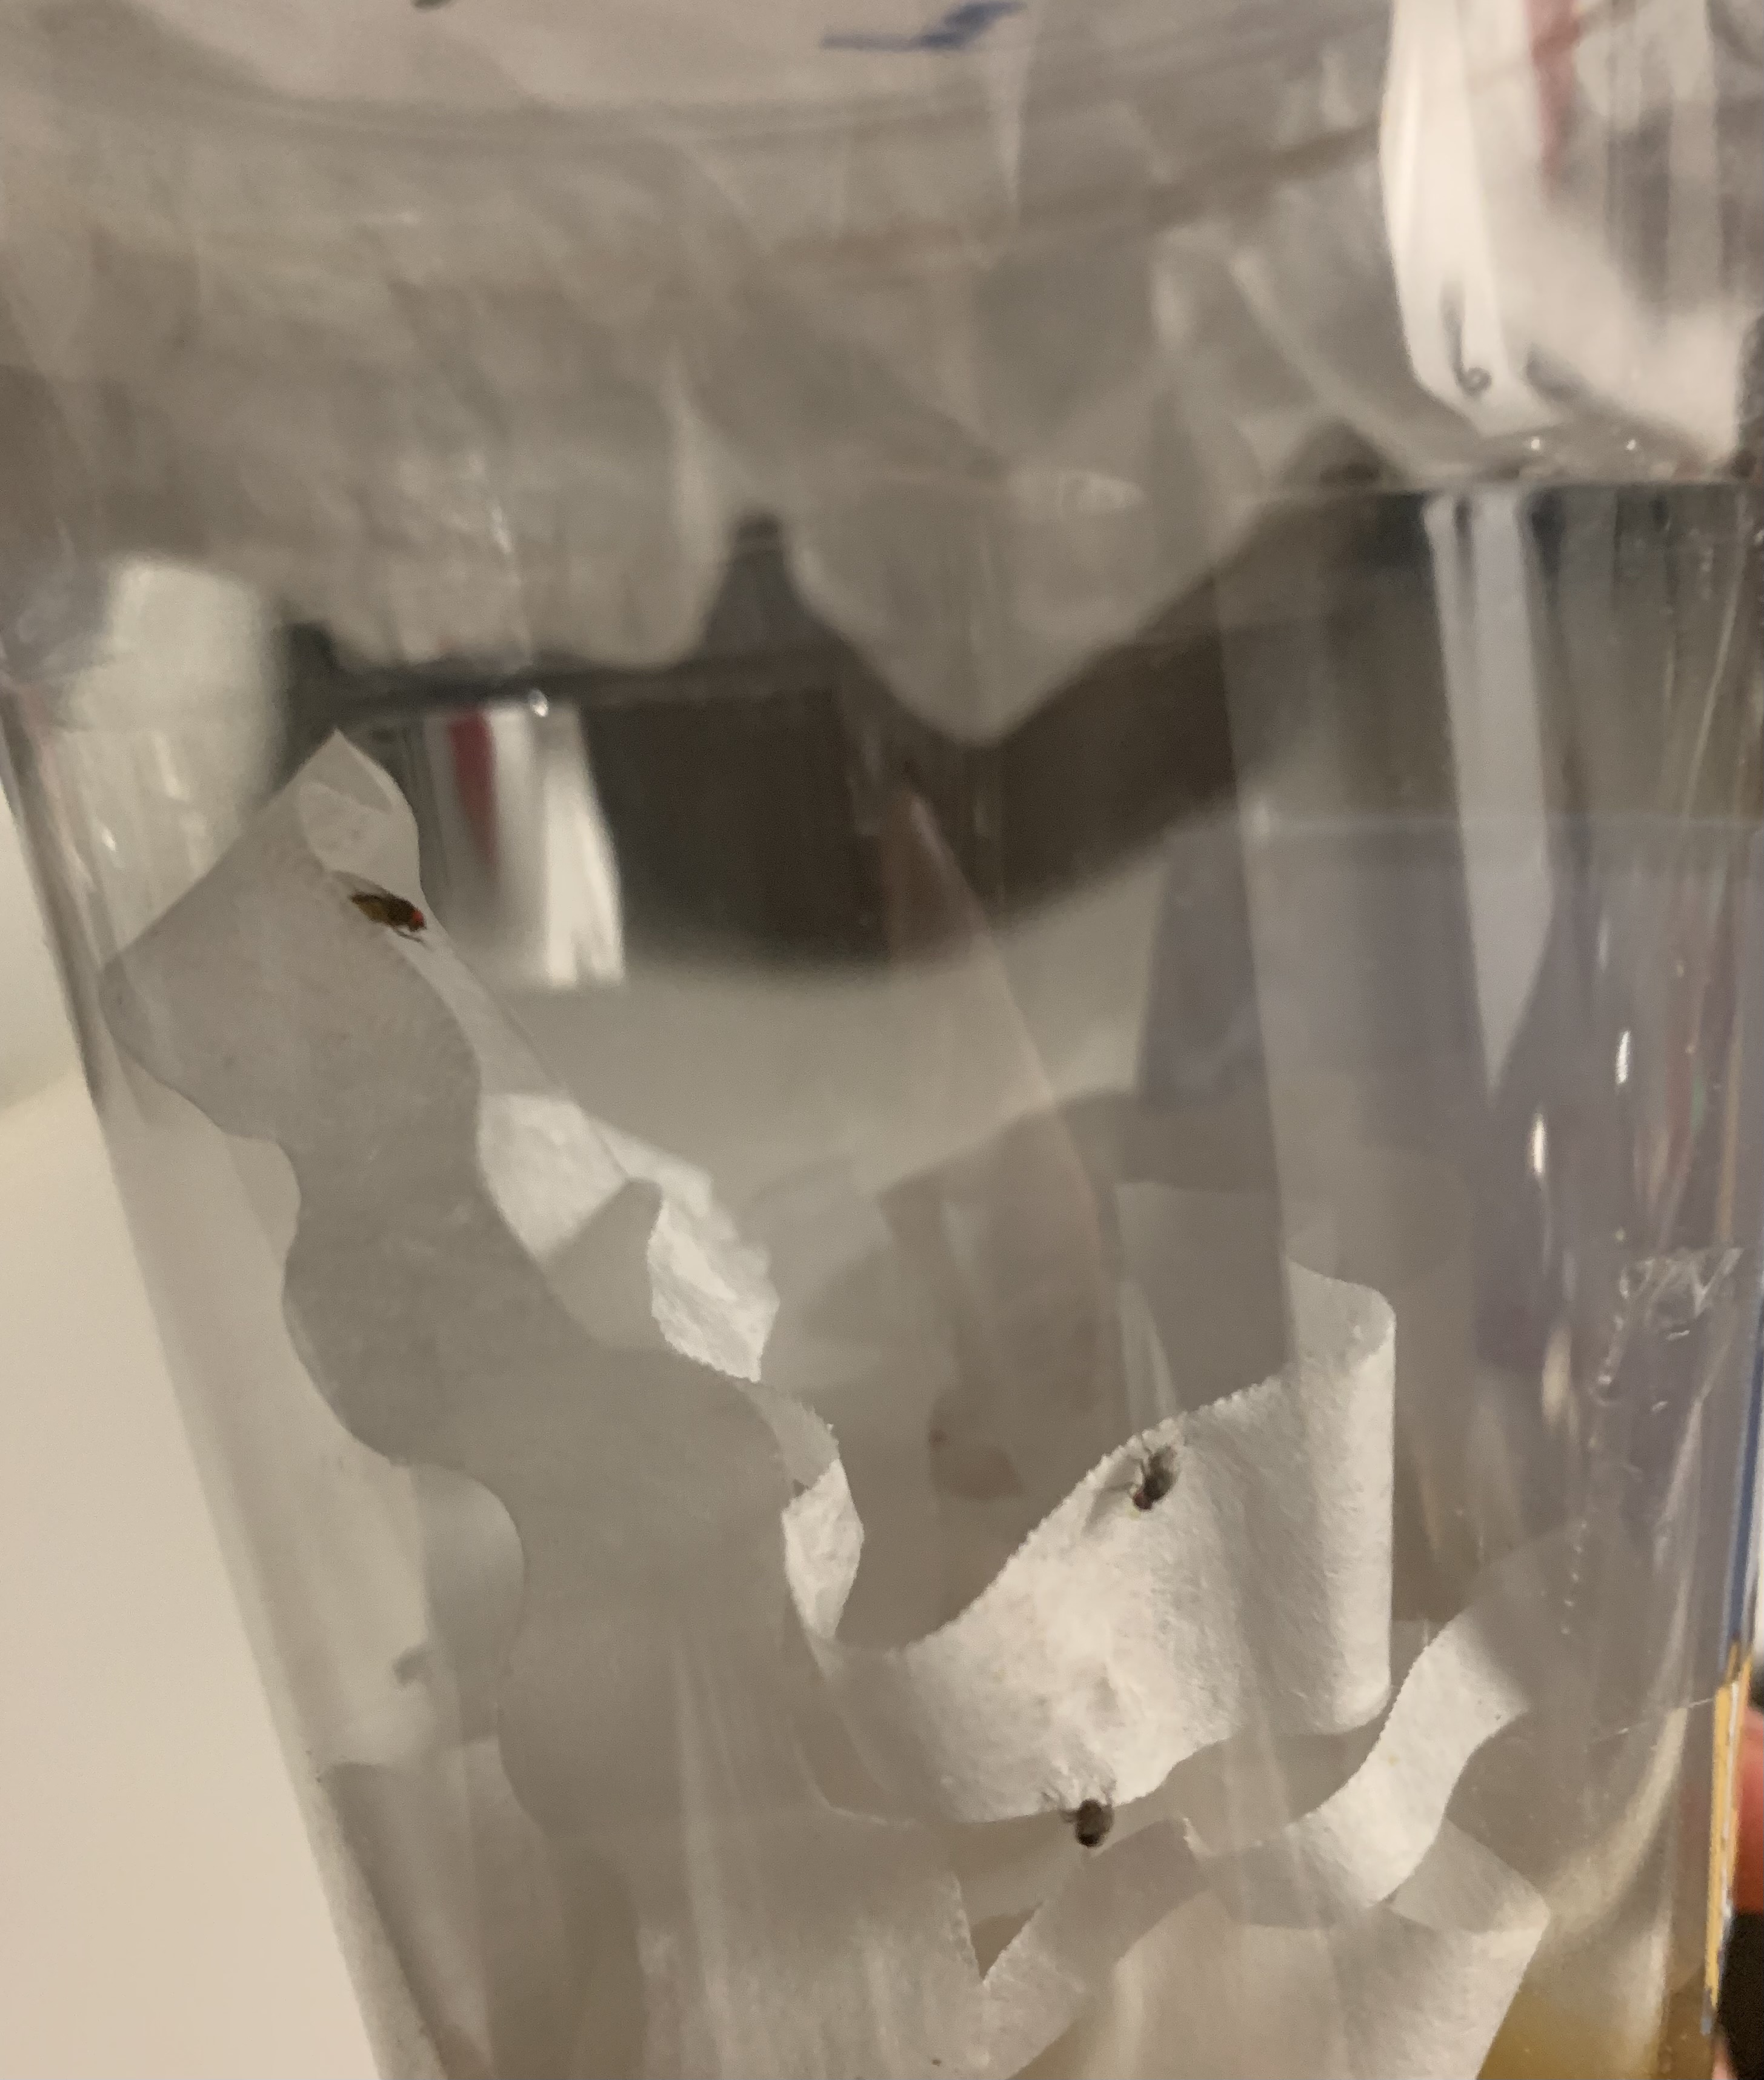
Figure 9: Image of 3 Pure-Omega-survived flies taken 9 days after first exposed to treatment.
Although no flies made it through the 19-day treatment period to be studied, this extending trial suggests a follow-up project to test the different intensities of omega-3 and alcohol on D. hydei’s genetic materials.
References
Barlow, P., Reeves, A., McKee, M., Galea, G., & Stuckler, D. (2016). Unhealthy diets, obesity and time discounting: A systematic literature review and network analysis. Obesity Reviews, 17(9), 810-819. https://doi.org/10.1534/genetics.114.171785
Chvilicek, M. M., Titos, I., & Rothenfluh, A. (2020). The Neurotransmitters Involved in Drosophila Alcohol-Induced Behaviors. Frontiers in Behavioral Neuroscience, 14. https://doi.org/10.3389/fnbeh.2020.607700
Farzaneh-Far, R. (2010). Association of marine omega-3 fatty acid levels with Telomeric aging in patients with coronary heart disease. JAMA, 303(3), 250. https://doi.org/10.1001/jama.2009.2008
Sanchez-Arroyo, H., & Capinera, J. L. (1998, August). House fly – Musca domestica Linnaeus. Entomology and Nematology Department – University of Florida, Institute of Food and Agricultural Sciences – UF/IFAS. https://entnemdept.ufl.edu/creatures/urban/flies/house_fly.htm
Topiwala, A., Taschler, B., Ebmeier, K. P., Smith, S., Zhou, H., Levey, D. F., Codd, V., Samani, N. J., Gelernter, J., Nichols, T. E., & Burgess, S. (2022). Alcohol consumption and telomere length: Mendelian randomization clarifies alcohol’s effects. Molecular Psychiatry, 27(10), 4001-4008. https://doi.org/10.1038/s41380-022-01690-9
Urry, L. A., Cain, M. L., Wasserman, S. A., Minorsky, P. V., & Orr, R. B. (2020). Campbell biology (12th ed.).
Victorelli, S., & Passos, J. F. (2017). Telomeres and cell senescence – Size matters not. EBioMedicine, 21, 14-20. https://doi.org/10.1016/j.ebiom.2017.03.027
Wangler, M. F., Yamamoto, S., & Bellen, H. J. (2015). Fruit Flies in Biomedical Research. Genetics, 199(3), 639-653. https://doi.org/10.1534/genetics.114.171785