Yixin (Sophie) Jiang – Applied Science
Abstract
Parking congestion in urban areas is a persistent issue that contributes to environmental, physical, and mental problems. This study built a two-part guided parking system to optimize the spot-finding process. The first part was a sensor network for detecting spot occupancy. The second part was a Python user interface that produced and launched the visuals of the parking lot statuses and an optimal parking path on an interactive webtool. The two components were bridged by Arduino IoT Things that functioned as real time databases, receiving status information from sensors, and synchronizing it to the user end. The system was functional and accurate in all scenarios, though the updating speed appeared to increase as more spot statuses were changed. Establishing a batch update approach, enhancing the path finding algorithm, creating a spot assignment feature, and exploring the use of more weather-resilient sensors are areas for future studies.
Introduction
Background
There are various problems associated with urban parking, affecting environmental, physical, and mental factors. Parking congestion remains a widespread issue in urban environments, and current parking systems often fail to provide optimal solutions for users. On average, a driver attending a high-demand event or crowded parking lot spends ten minutes looking for a space (Grodi et al., 2016). On an environmental scope, the CO2 emissions of non-optimal drivers were almost triple compared to optimal drivers during visitor peak hours (Paidi et al., 2022). A prolonged parking process also results in driver frustration and distraction – a dominant factor in crash risks (Rowe et al., 2015).
Literature Review
In an attempt to address parking issues, there have been multiple published papers regarding smart parking. The studies investigated solutions with three main approaches.
The first involved creating statistical models. A study proposed a real-time occupancy model that sought to describe and predict overall destination occupancy accurately by utilizing existing data sources (Hössinger et al., 2013). The research presented one approach to parking traffic management: informing drivers of parking situations and allowing efficient trip planning. The limitation of the research lies in the model’s inherent inability to adapt to daily deviations and rapidly changing urban dynamics; the collection of vast amounts of data may also prove to be difficult in certain areas.
The second leveraged convolutional neural networks, applying deep learning models to camera modules to scan parking spots and determine spot occupancy (Amato et al., 2016). The approach was validated through experiments and datasets, highlighting the applicability of deep learning in real-time parking space occupancy detection. Yet lighting conditions and changes in paired software could hamper accuracy.
Third, the Department of Electrical Engineering at Georgia Southern University published research on parking occupancy monitoring and visualization systems (Grodi et al., 2016). The paper presented a prototype that employed a wireless sensor network (WSN) to detect and transmit parking spot statuses (occupied or idle) to a My SQL database. The stored statuses were then shown on a website and updated at regular intervals. The research provided extensive insight into the implementation of sensor-embedded parking lots.
Purpose
This research aims to combine past approaches, creating a guided parking system that maximizes commercial interest, accuracy, and user accessibility. A parking lot model will be built with a flexible sensor network for detecting spot occupancy. On the user end, a web application will be constructed to inform drivers of available spots and provide the optimal path to the closest available spot.
Materials and Methods
The development of the guided parking system involved two main components: a sensor network, and a user interface display. There was an intermediate database that received information from the sensors and provided the received information for the user end (Figure 1).
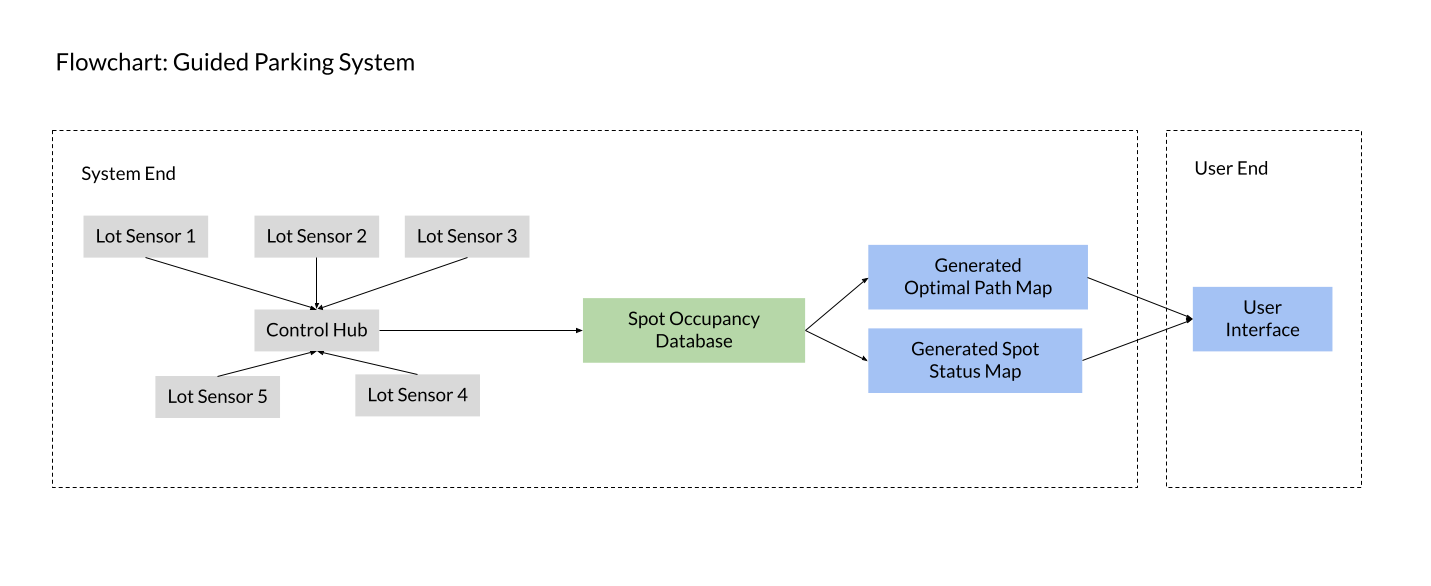
Figure 1: Guided parking system diagram. Color coded based on components: sensor network (grey), database (green), user interface (blue).
All the program files are provided under the MIT License at https://github.com/sophieJ07/GuidedParkingSystem.
Sensor Network
Five HC-SR04 ultrasonic ranging modules were employed in the project. These modules are equipped with ultrasonic transmitters, receivers, and control circuits, enabling them to calculate distance by measuring the time it takes for ultrasonic signals to travel from the transmitter to the receiver (ElecFreaks, 2011). In the parking lot model, sensors were strategically positioned underneath designated spots, with the ultrasonic transmitter and receiver facing upwards, aligning with where cars would be parked. By determining distance to the closest obstacle above, the sensors offered readings that indicate the presence or absence of a car in the respective parking spot.
All five HC-SR04 sensors were connected to an Arduino MKR 1000 WiFi (MKR 1000 WiFi, 2024) on a breadboard using jumper wires (Figure 2). The Vcc and GND pins were connected to 5V and ground, respectively. The trigger and echo pins were connected to the digital pins of the Arduino. Since the MKR 1000 WiFi operated at 3.3V and the HC-SR04 sensors operated at 5V, the logic level for the echo pulse was shifted through a voltage divider before connecting to digital pins. The equation to calculate the voltage drop across resistors was Vo = (R2 / (R1+R2)) x Vi. By using a 10K Ohm resistor for R1, and a 22K Ohm resistor for R2, the voltage output from the HC-SR04 sensors, 5V, was dropped to approximately 3.4V (Figure 3).
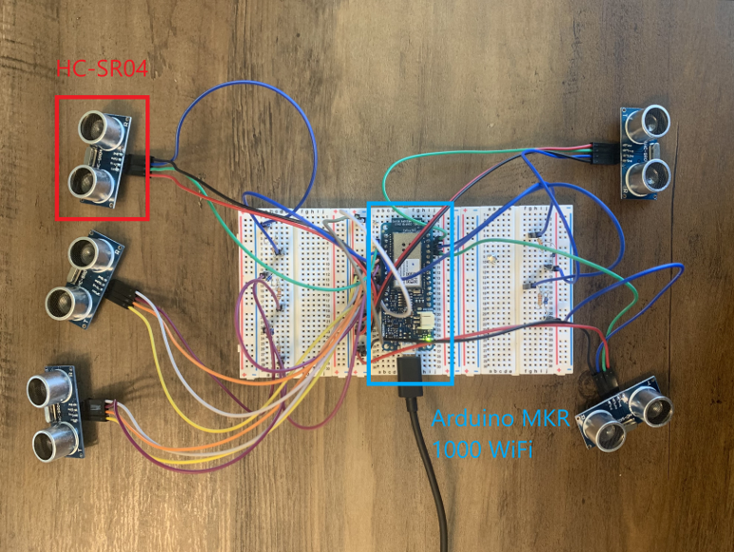
Figure 2. HC-SR04 sensors connected to the Arduino MKR 1000 WiFi.
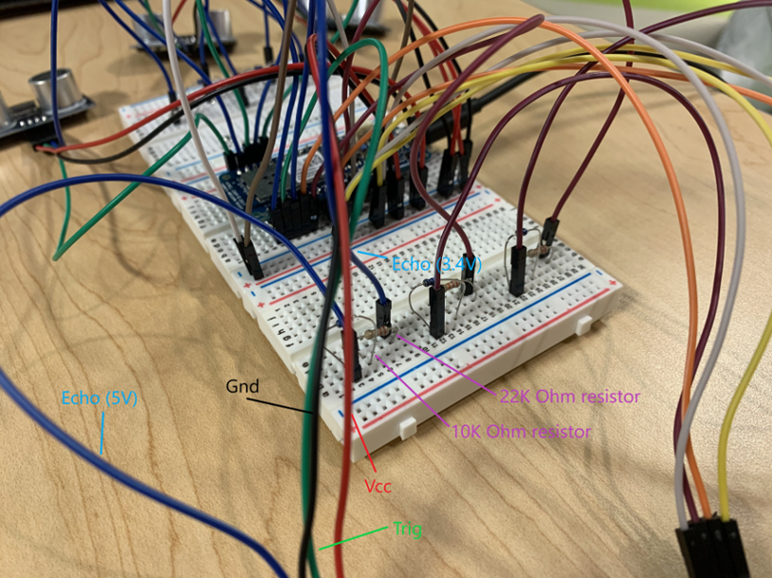
Figure 3. Labeled wiring of one HC-SR04 sensor with voltage divider.
The Arduino was coded to initialize serial communication (Figure 4). Constantly, a loop iterated through the five sensors, triggering the ultrasonic pulses, measuring the echo duration, and converting the time readings to distance in centimeters using dedicated conversion functions that took the speed of sound in air into account (ElecFreaks, 2011).
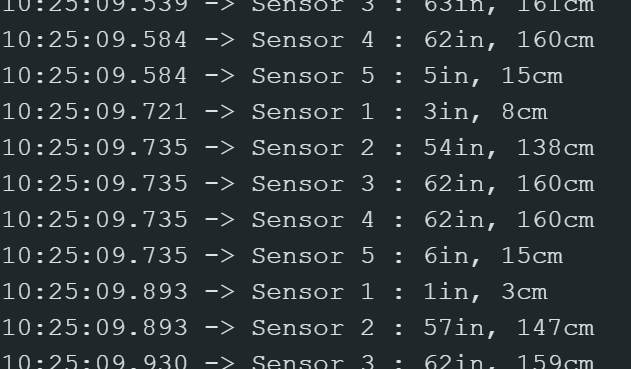
Figure 4. Constant sensor readings.
Database Setup
The Arduino Cloud was used to set up IoT connections.
The Arduino sketch and board were configured and connected to an Arduino “Thing” named SpotStatus (Figure 5), used to establish connection between the IoT device and the Arduino Cloud (Things, 2024). This allowed the use of cloud variables for storing parking spot statuses. In the Arduino sketch uploaded to the board, the sensor readings were constantly checked. If the sensor returned a distance of less than 10 centimeters, the program deduced that there was a car occupying the spot (covering the sensor) and changed the respective spot cloud variable to “false.” Otherwise, the spot cloud variable was updated to “true.”
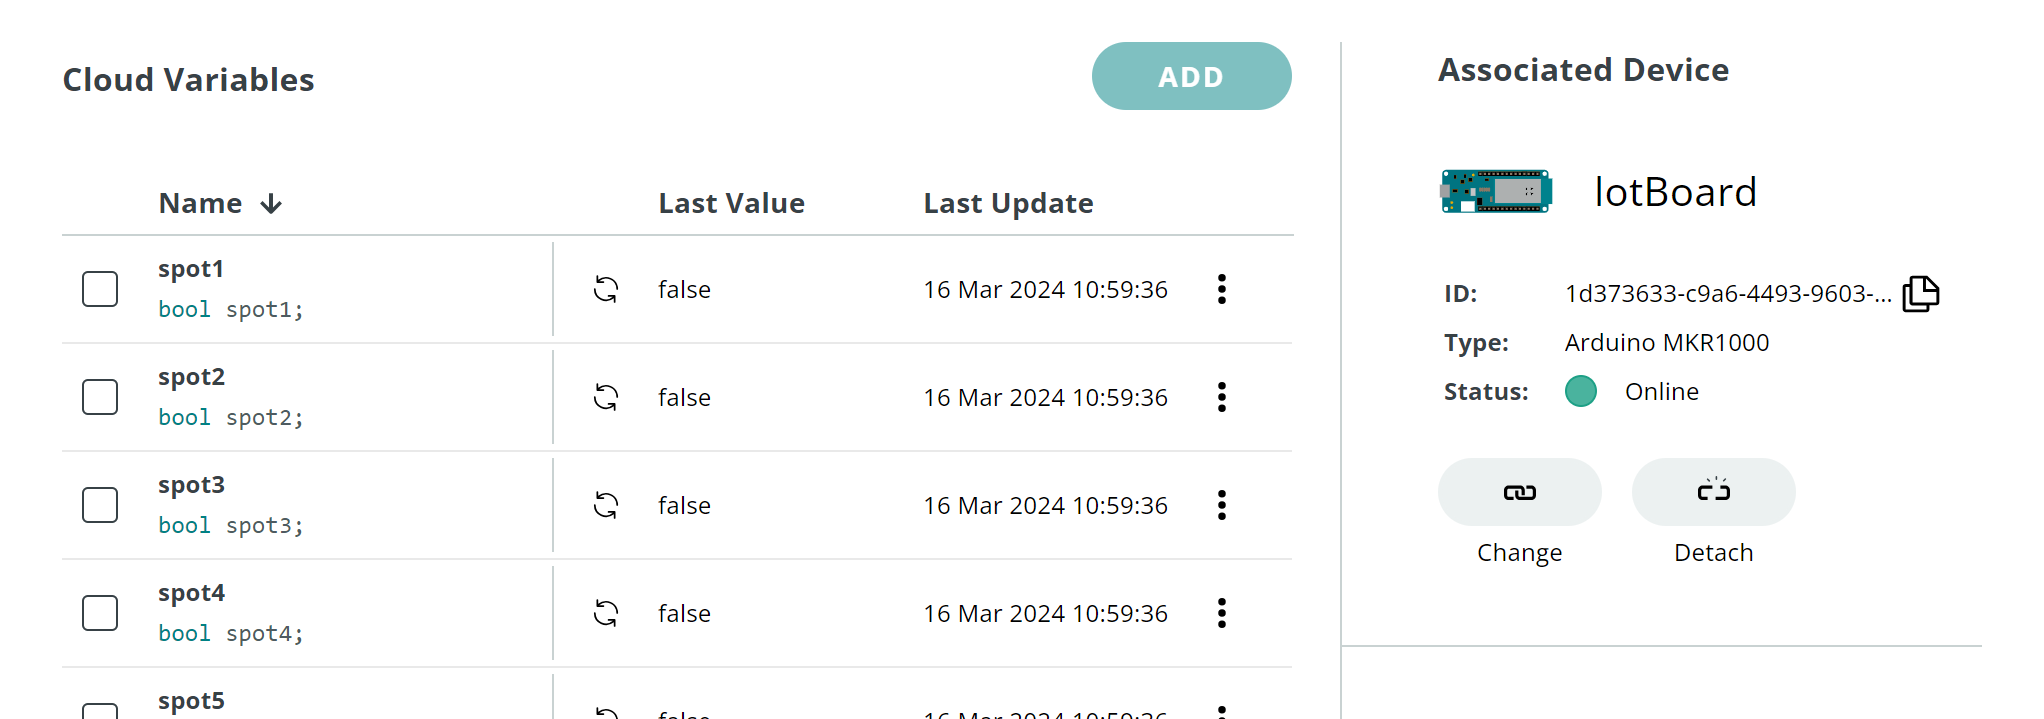
Figure 5. The SpotStatus Arduino IoT thing. It is connected to the Arduino MKR 1000 Wifi and has Boolean cloud variables to store the parking spots’ status (“false” (occupied) / “true” (available)).
Another Arduino “Thing” named UserEnd (Figure 6) was created to initiate connection between the Arduino cloud and Python (which would be used for the user interface). All the parking spot cloud variables in UserEnd were set up to be coordinated with their respective spot variables in SpotStatus. As a result, when the variables in SpotStatus were updated via the sensor readings, UserEnd would also be updated and prepared to feed the information to Python.
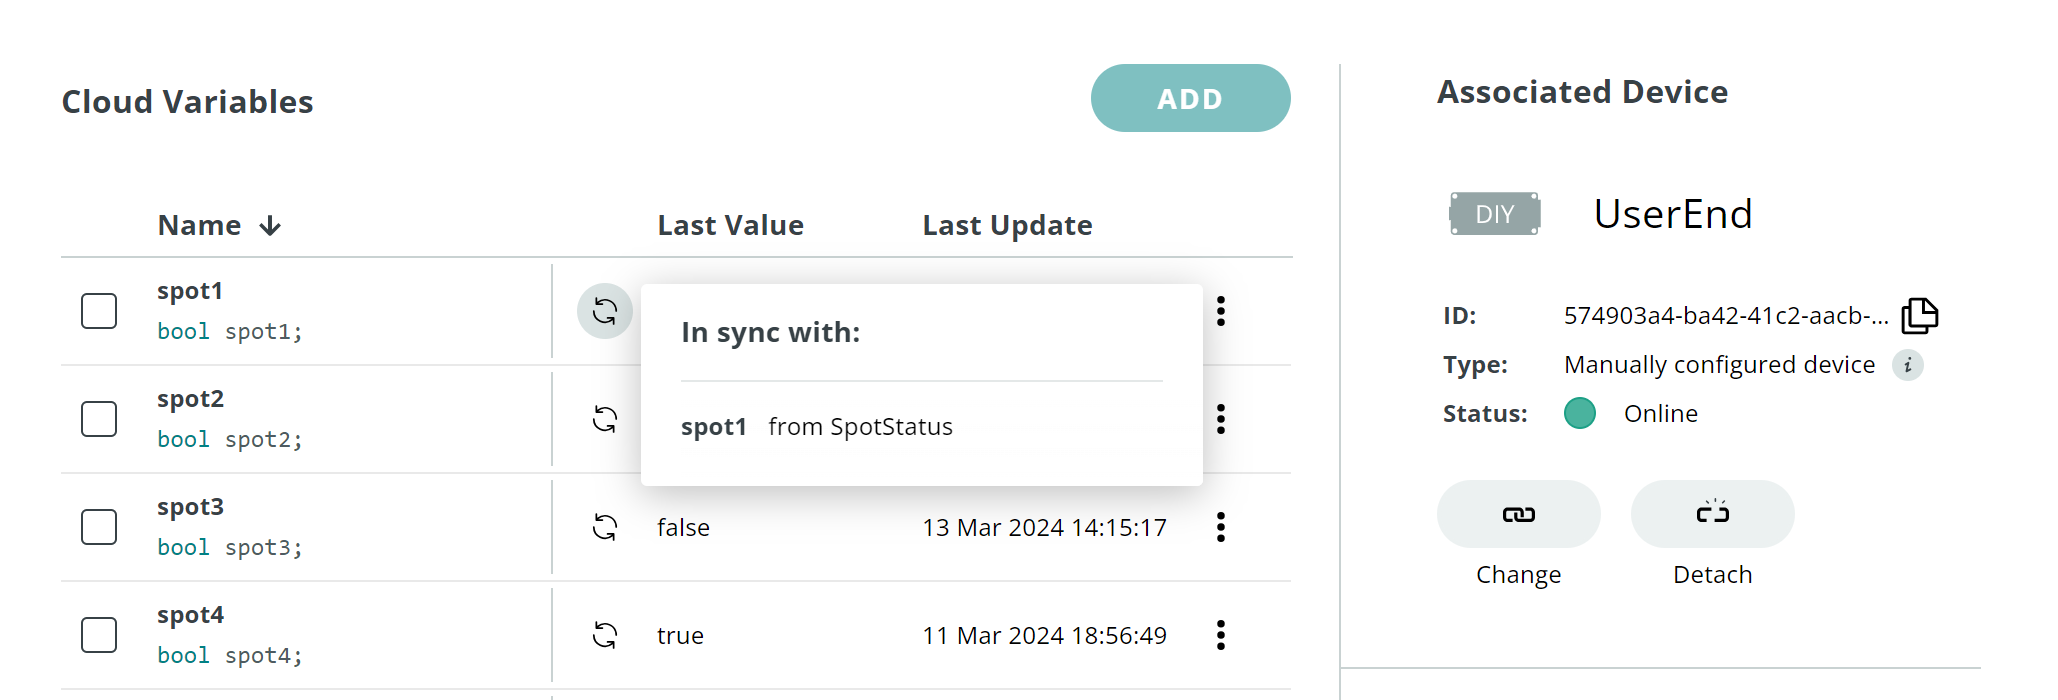
Figure 6. The UserEnd Arduino IoT thing. Its cloud variables are in sync with those in SpotStatus.
User Interface
The user interface was programmed with Python. The steps to develop the interface involved establishing connection with the database, producing a visual of the parking lot status, and launching the visuals on an interactive webtool.
First, the Arduino IoT Cloud Python Client library was utilized to interact with Arduino Cloud (Python, 2024). The necessary modules for using the library were imported. Then, a callback function was defined for each of the spot variables to oversee updates. The callback functions updated a global NumPy status array based on the value received from the Cloud whenever the variable was changed, and then called an update() function (detailed below) to generate a visual of the new parking lot status. To run, a start_iot_client() function was created to initialize the client with a device ID and secret key, register each cloud variable with their respective callback functions, and start the client within an asyncio event loop.
Second, an update() function was created to produce visuals of the parking lot status. Thirty spots were drawn to better simulate a full-sized parking lot; the five sensor-equipped spots were sprinkled across the thirty spots. The Matplotlib library (Matplotlib.pyplot — Matplotlib 3.5.2 Documentation, n.d.) was imported and used to create a 5×6 grid of subplots, where each subplot represented a parking spot. Based on the global NumPy status array (which, as mentioned above, was updated by the callback functions), the update() function annotated the subplots: the spots were labeled with either a red car image or a green circle, indicating the occupancy data. After the illustration was complete, the generated status image was saved as “status.png,” and two other functions were called to generate and save another image that contained a drawn path to the nearest empty spot, “path.png.”
A find_nearest_empty_spot() function determined the optimal driving distance of each available parking spot and returned the spot with the closest driving distance. A draw_path_to_empty_spot() function drew the optimal path from the entrance to the calculated closest spot (Figure 7). The path was drawn by evaluating the position of the given spot and creating lines based on the number of rows and columns of spots the car must drive by to reach its destination.
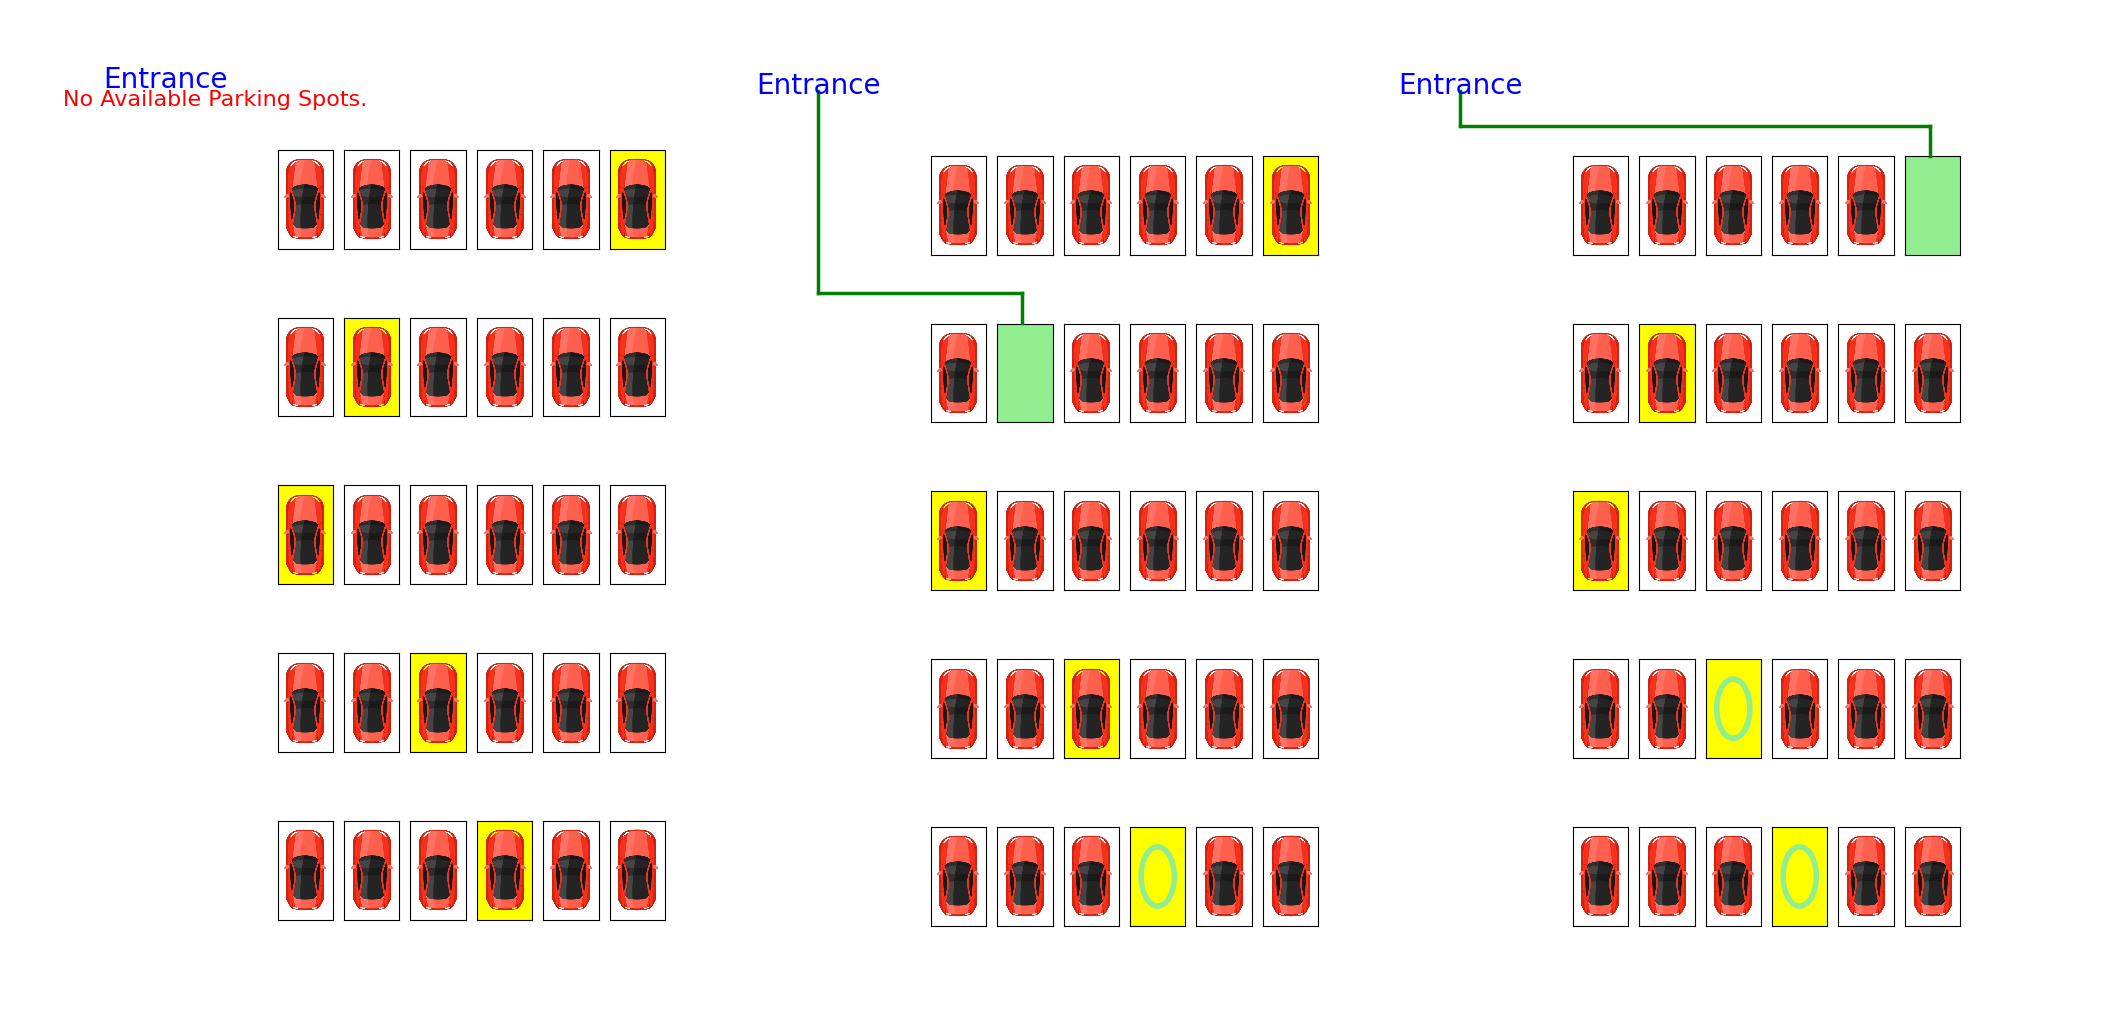
Figure 7. Some generated illustrations of the 5×6 parking lot. The highlighted spots were sensor-equipped.
Third, the Python Dash framework (Dash Documentation & User Guide | Plotly, n.d.) was used to create a web application. The app included two buttons, “Find Spot” and “Refresh,” and an image element displaying a parking image (Figure 8). Constantly, the Dash app encoded the most updated “status.png” and “path.png” to base64 using the encode_image function and displayed those images on a layout that was defined with HTML elements.

Figure 8. The spot-finding web application running on a local server.
An asynchronous function main() was coded to run the Dash app server using app.run_server(). Then, it awaits the execution of start_iot_client().The full script was run using asyncio.run(main()), which kicked off the main coroutine function, main(), to run the Dash app server and start the IoT client asynchronously (Asyncio — Asynchronous I/O — Python 3.9.7 Documentation, n.d.). This approach allowed both the Dash app server and the IoT client to run concurrently within the same event loop.
Results
There was a total of 25=32 arrangements of lot occupancy: Each sensor-equipped parking spot has two possible statuses – occupied or not – and all these possibilities could be multiplied to find the total possible arrangements among the 5 spots. All thirty-two of these scenarios were evaluated.
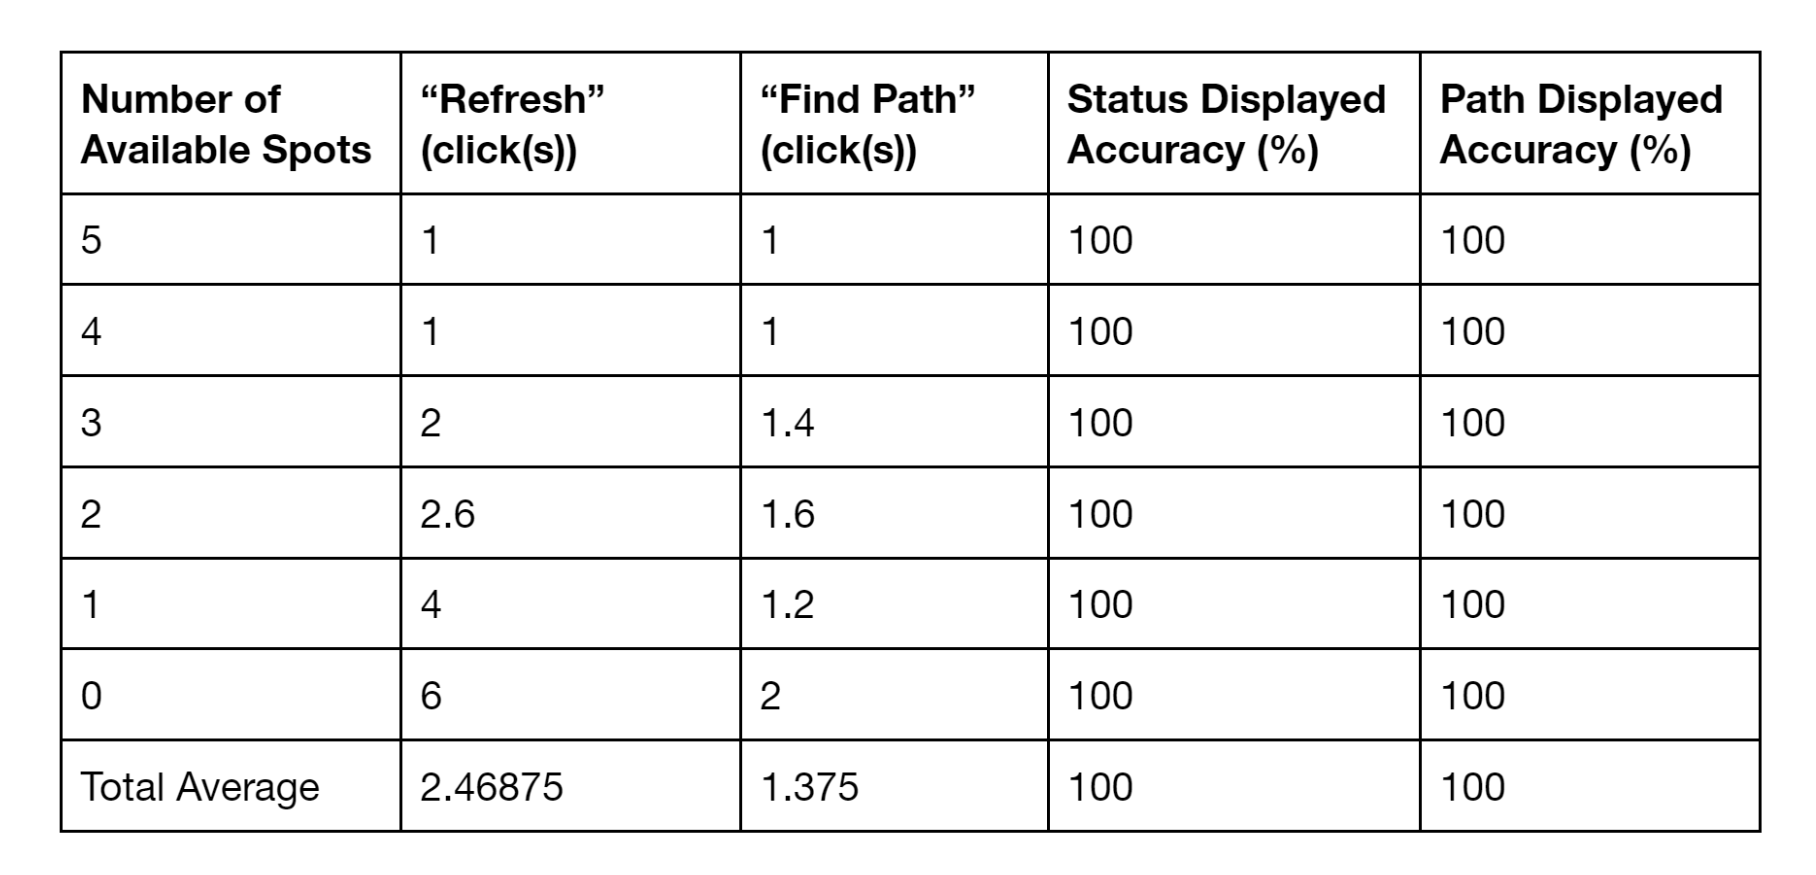
The user interface was launched. At the start of each trial, the sensors were left in the open and thus all sensor-equipped spots were presumed to be unoccupied. For each scenario assessed, a piece of paper was placed on top of the sensors of the spots that were designated to be “occupied.” The “Refresh” button was clicked every one second until the app displayed the updated statuses. Then, the “Find Spot” button was clicked every one second until the app displayed a path to the closest spot. The number of clicks were recorded, and the accuracy of the images displayed were checked (Figure 9). The trials were sorted based on the number of available spots in the given scenario, and the data collected was averaged for each group as shown in Table 1.
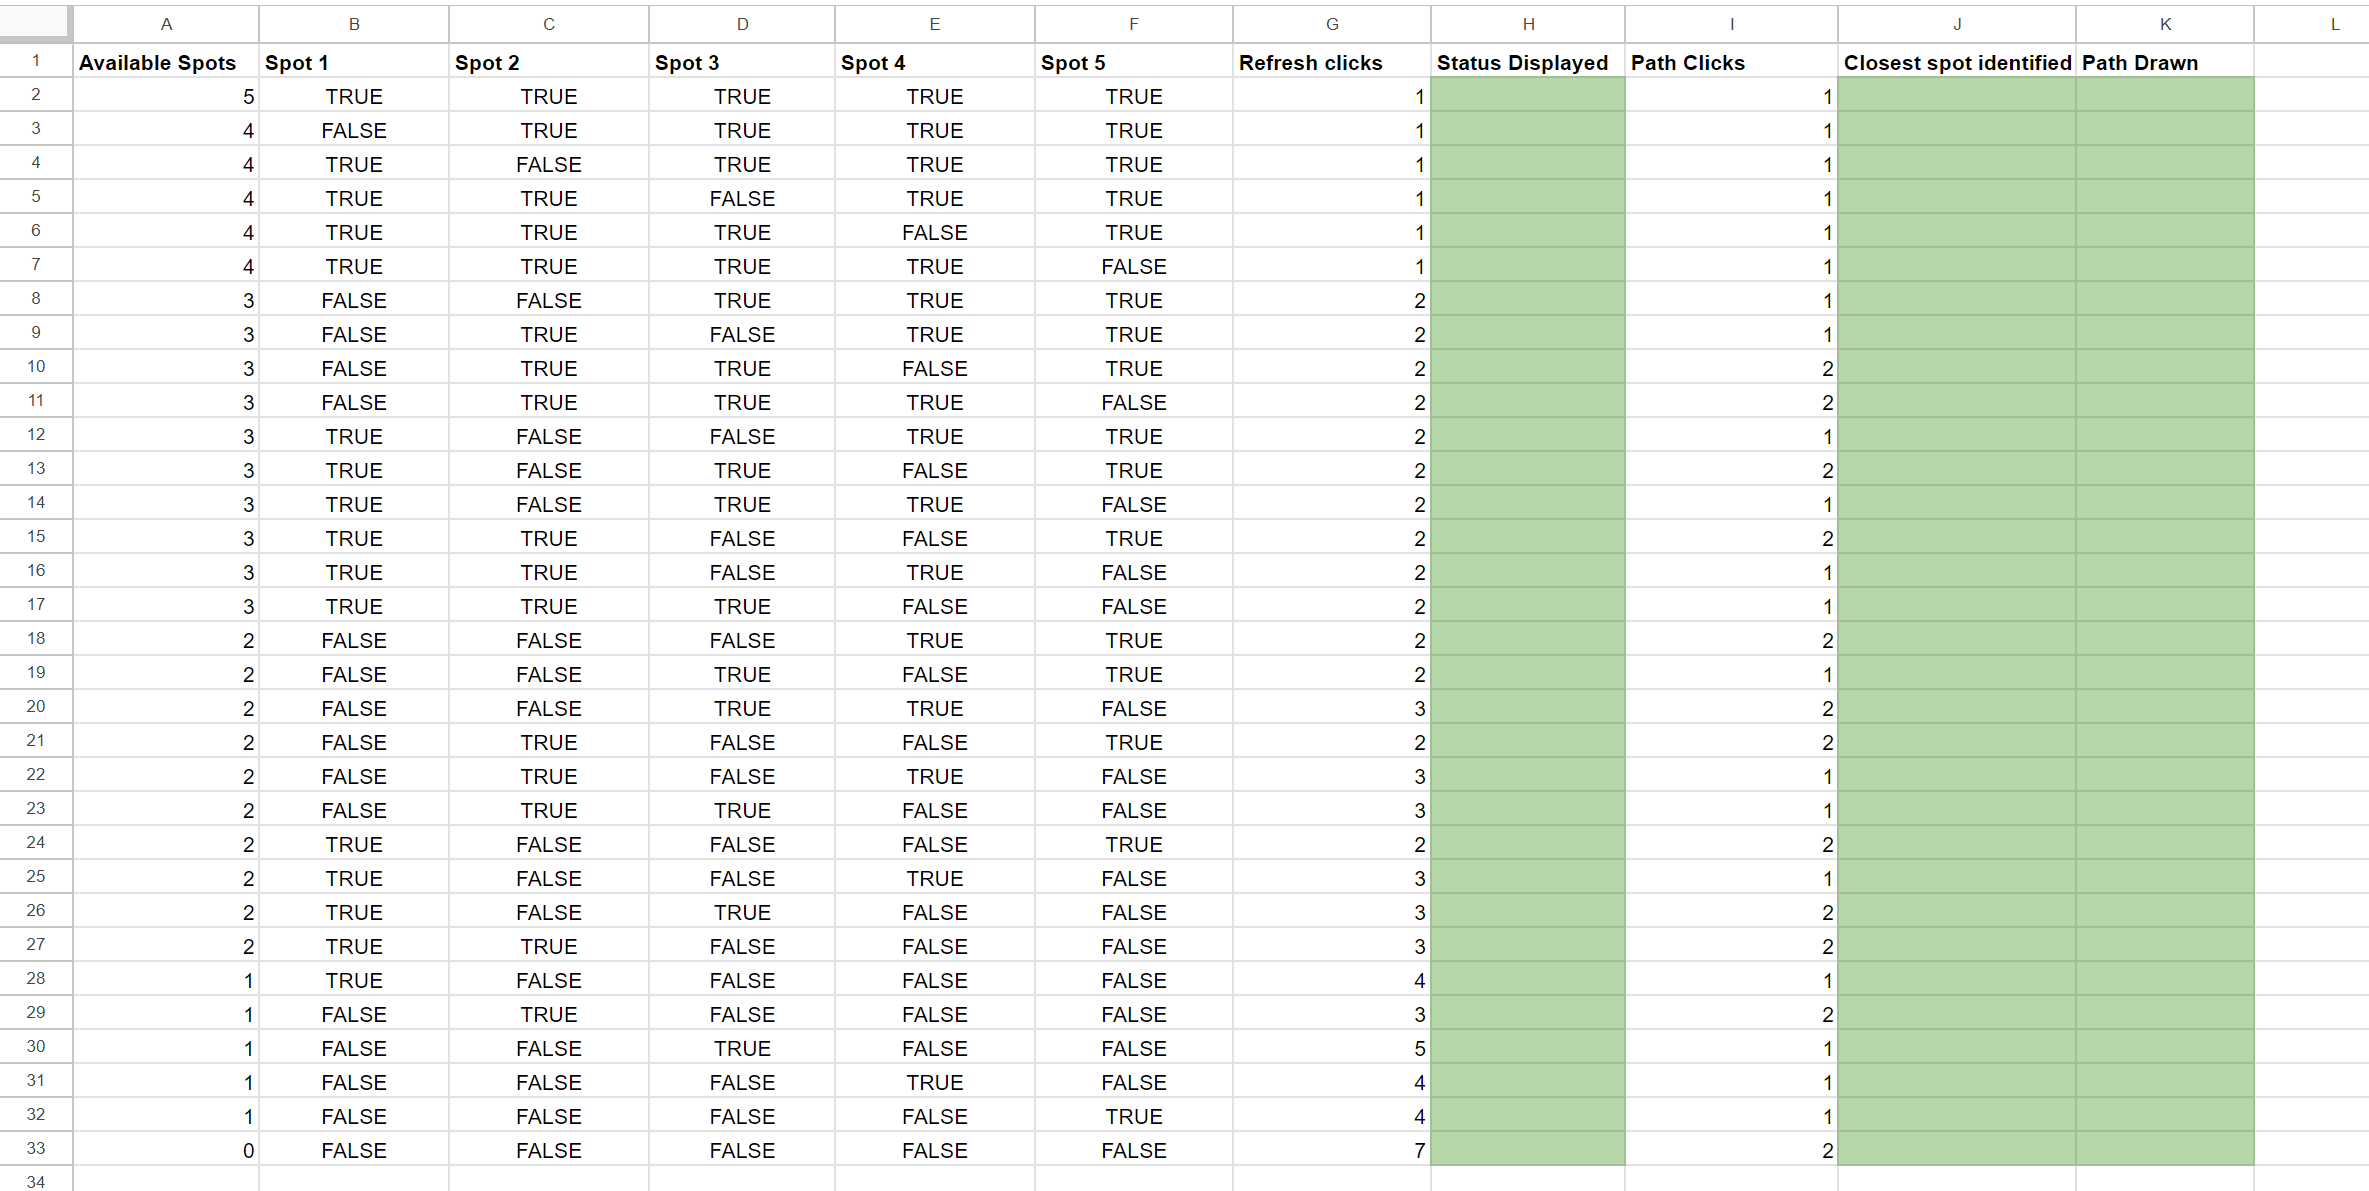
Figure 9. Google Sheet used to store the trial results.
Table 1. Tabulated average results, grouped based on the number of available spots in the trial.
Discussion
Interpretation of Results
The outcome demonstrated the functionality of each component in the project. For the sensor network, the sensors were able to measure the distance and the Arduino was able to receive and interpret the data. Both databases, SpotStatus and UserEnd Arduino Cloud IoT Things, consistently maintained up-to-date records. On the user end, the Python program efficiently generated visual representations of parking lot statuses alongside paths, while the web application was launched without issues, featuring fully operational buttons.
However, as more sensors were covered, an increase in button clicks was required to update the displayed status and paths. This trend was expected, as additional computation was necessary when more Cloud variables were updated. More updated variables transmitted to Arduino Cloud led to an increase in data retrieval demands for Python callback functions. The cumulative effect of the short delay accompanying each variable change significantly impacted system speed. Additionally, since the update() function was executed each time a variable changed, it resulted in the generation and storage of two images for every variable alteration. This repetitive function calling further impeded system performance.
A potential solution to enhance system speed could involve optimizing the update process. Instead of generating and saving images for every variable change, a batch update approach could be implemented. This approach would involve aggregating variable changes over a certain period and executing the update() function once with all the accumulated changes, thereby reducing the number of function calls.
Further Study
Three key areas of limitations posed room for further studies. Firstly, the system employed a simplified method of path finding and drawing. This method was viable given that the model parking lot was arranged in a grid and had set row and column lengths. For the system to be more applicable for other parking lots, such as those with multiple floors and a more complex, non-grid-like spot arrangement, a more advanced pathfinding algorithm could be implemented. This could require envisioning locations in the lot as nodes and applying a suitable shortest path-finding algorithm, such as the ones highlighted in Bruce Golden’s study (Golden, 1976).
Second, in situations in which multiple cars arrive at the parking lot consecutively (the car in front has yet to be parked by the time the following driver checks the interface), the current system would lead the cars to the same parking spot. An area of further study could be enhancing the system so that it is able to support multiple users simultaneously by assigning different available spots to each, ensuring smooth operation during peak times.
Thirdly, the effectiveness of ultrasonic sensors would be dramatically reduced if the parking lot was situated outdoors, since the HR-SR04s were not waterproof and were fragile. Looking into ultrasonic distance sensors that perform well in harsh environments – impervious to dust, dirt, and water – could better prepare the system for real-life usage (Workshop, 2021).
References
Amato, G., Carrara, F., Falchi, F., Gennaro, C., & Vairo, C. (2016). Car parking occupancy detection using smart camera networks and Deep Learning. 2016 IEEE Symposium on Computers and Communication (ISCC), 1212–1217. https://doi.org/10.1109/iscc.2016.7543901
asyncio — Asynchronous I/O — Python 3.9.7 documentation. (n.d.). Docs.python.org. https://docs.python.org/3/library/asyncio.html
Dash Documentation & User Guide | Plotly. (n.d.). Dash.plotly.com. https://dash.plotly.com/
ElecFreaks. (2011). Ultrasonic Ranging Module HC -SR04. https://cdn.sparkfun.com/datasheets/Sensors/Proximity/HCSR04.pdf
Golden, B. (1976). Technical Note—Shortest-Path Algorithms: A Comparison. Operations Research, 24(6), 1164–1168. https://doi.org/10.1287/opre.24.6.1164
Grodi, R., Rawat, D. B., & Rios-Gutierrez, F. (2016). Smart parking: Parking occupancy monitoring and visualization system for smart cities. SoutheastCon 2016, 1–5. https://doi.org/10.1109/secon.2016.7506721
Hössinger, R., Widhalm, P., Ulm, M., Heimbuchner, K., Wolf, E., Apel, R., & Uhlmann, T. (2013). Development of a Real-Time Model of the Occupancy of Short-Term Parking Zones. International Journal of Intelligent Transportation Systems Research, 12(2), 37–47. https://doi.org/10.1007/s13177-013-0069-5
matplotlib.pyplot — Matplotlib 3.5.2 documentation. (n.d.). Matplotlib.org. https://matplotlib.org/stable/api/pyplot_summary.html
MKR 1000 WiFi. (2024). Arduino.cc. https://docs.arduino.cc/hardware/mkr-1000-wifi/#features
Paidi, V., Håkansson, J., Fleyeh, H., & Nyberg, R. G. (2022). CO2 Emissions Induced by Vehicles Cruising for Empty Parking Spaces in an Open Parking Lot. Sustainability, 14(7), 3742. https://doi.org/10.3390/su14073742
Python. (2024). Arduino.cc. https://docs.arduino.cc/arduino-cloud/guides/python/
Rowe, R., Roman, G. D., McKenna, F. P., Barker, E., & Poulter, D. (2015). Measuring errors and violations on the road: A bifactor modeling approach to the Driver Behavior Questionnaire. Accident Analysis & Prevention, 74, 118–125. https://doi.org/10.1016/j.aap.2014.10.012
Things. (2024). Arduino.cc. https://docs.arduino.cc/arduino-cloud/cloud-interface/things/
Workshop, D. (2021, October 5). Waterproof Ultrasonic Distance Sensors with Arduino. DroneBot Workshop. https://dronebotworkshop.com/waterproof-ultrasonic/